based on the line of best fit that most closely approximates these data, which two statements are valid…
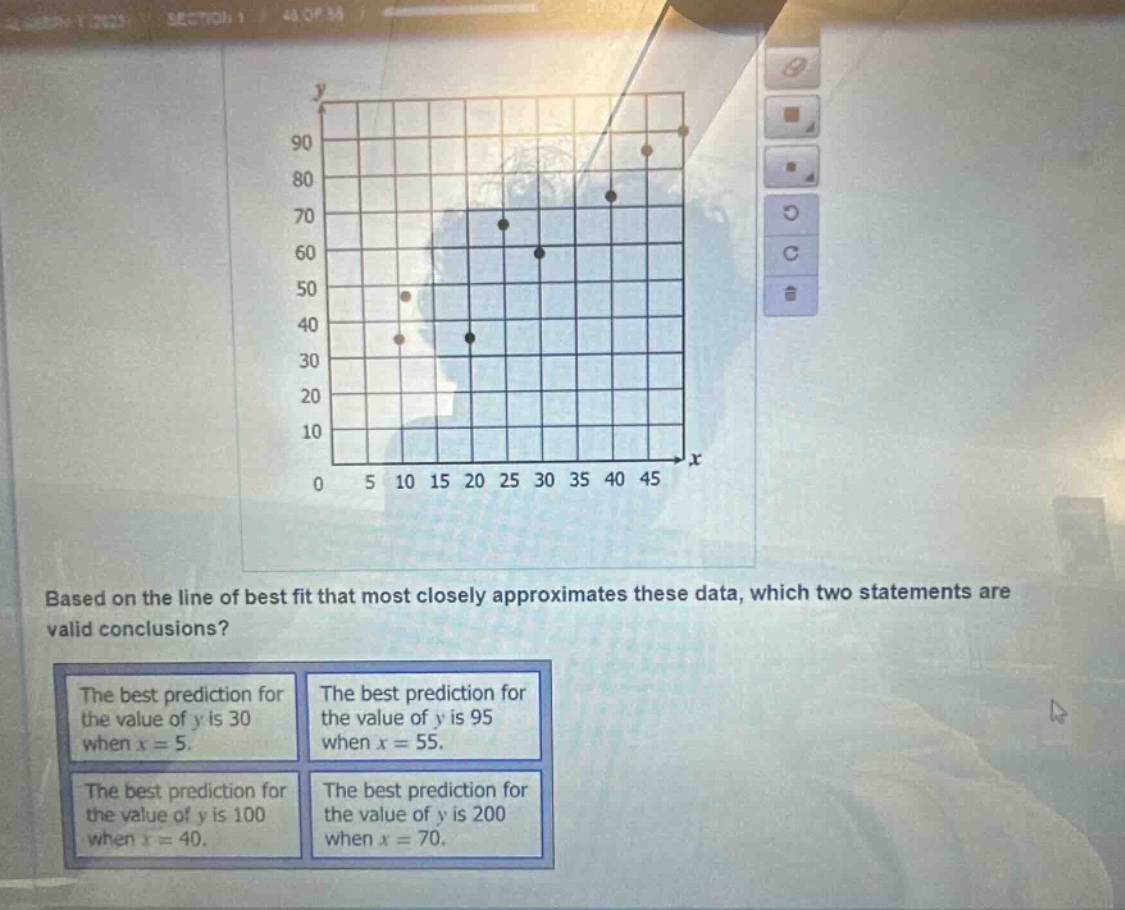
based on the line of best fit that most closely approximates these data, which two statements are valid conclusions? the best prediction for the value of y is 30 when x = 5. the best prediction for the value of y is 95 when x = 55. the best prediction for the value of y is 100 when x = 40. the best prediction for the value of y is 200 when x = 70.
Answer
Explanation:
Step1: Visualize line of best - fit
Estimate the trend of the line passing through the data points.
Step2: Check for (x = 5)
Looking at the graph, when (x = 5), (y) is around (30).
Step3: Check for (x = 55)
Extending the line of best - fit, when (x=55), (y) is around (95).
Step4: Check for (x = 40)
When (x = 40), (y) is around (70 - 80), not (100).
Step5: Check for (x = 70)
Extending the line further, (y) at (x = 70) is not close to (200).
Answer:
The best prediction for the value of (y) is (30) when (x = 5); The best prediction for the value of (y) is (95) when (x = 55).