based on the scatter plot below, which is a better prediction for x when y = 0?
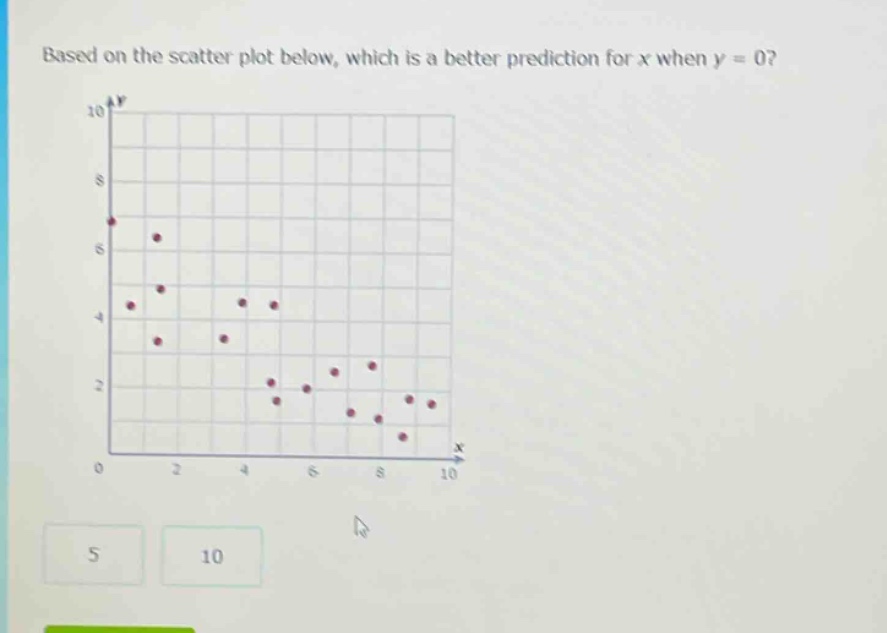
based on the scatter plot below, which is a better prediction for x when y = 0?
Answer
Explanation:
Step1: Observe the scatter - plot trend
As y decreases, x increases. When y = 0, by visually extending the general trend of the points, x is likely to be around 10.
Answer:
10