based on the scatter plot below, which is a better prediction for y when x = 5?
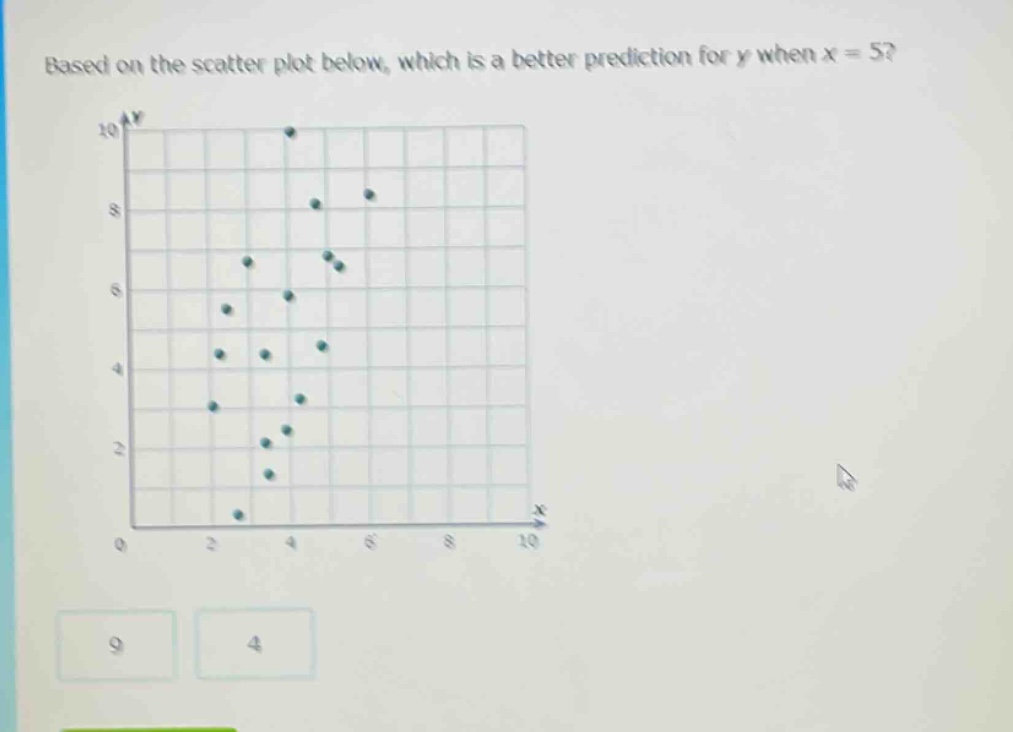
based on the scatter plot below, which is a better prediction for y when x = 5?
Answer
Explanation:
Step1: Observe the scatter - plot trend
By looking at the scatter - plot, we can see that as (x) increases from 2 to 6, the (y) - values seem to be in the range of 2 - 8.
Step2: Estimate for (x = 5)
When (x = 5), based on the overall distribution of points, a value of (y = 4) seems more in line with the trend of the data points compared to (y = 9).
Answer:
4