based on the scatter plot below, which is a better prediction for x when y = 8?
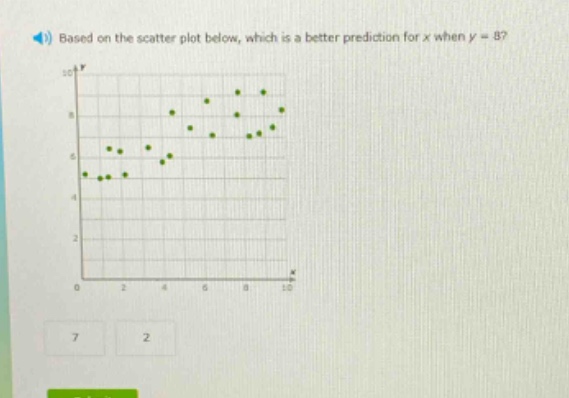
based on the scatter plot below, which is a better prediction for x when y = 8?
Answer
Explanation:
Step1: Locate y - value on plot
Locate y = 8 on the y - axis of the scatter - plot.
Step2: Estimate x - value
Look horizontally across from y = 8 to the data points and then vertically down to estimate the x - value. The data points seem to cluster around x = 7 when y = 8.
Answer:
7