bella works at a popular clothing store. last winter, her manager asked her to track the stores sweater…
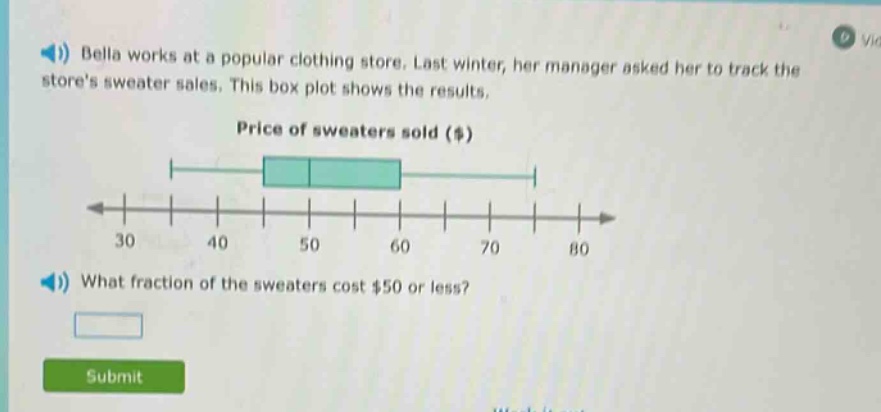
bella works at a popular clothing store. last winter, her manager asked her to track the stores sweater sales. this box plot shows the results. price of sweaters sold ($) what fraction of the sweaters cost $50 or less?
Answer
Explanation:
Step1: Understand box - plot quartiles
In a box - plot, the box is divided into quartiles. The left - hand side of the box represents the first quartile ($Q_1$), the middle line of the box represents the median ($Q_2$), and the right - hand side of the box represents the third quartile ($Q_3$). The whiskers represent the minimum and maximum values.
Step2: Identify the position of $50$
The value of $50$ is at the first quartile ($Q_1$) of the box - plot.
Step3: Determine the fraction
The first quartile represents 25% or $\frac{1}{4}$ of the data. So the fraction of sweaters that cost $50$ or less is $\frac{1}{4}$.
Answer:
$\frac{1}{4}$