which best describes the purpose of bar graphs?\no they show changes over a period of time.\no they compare…
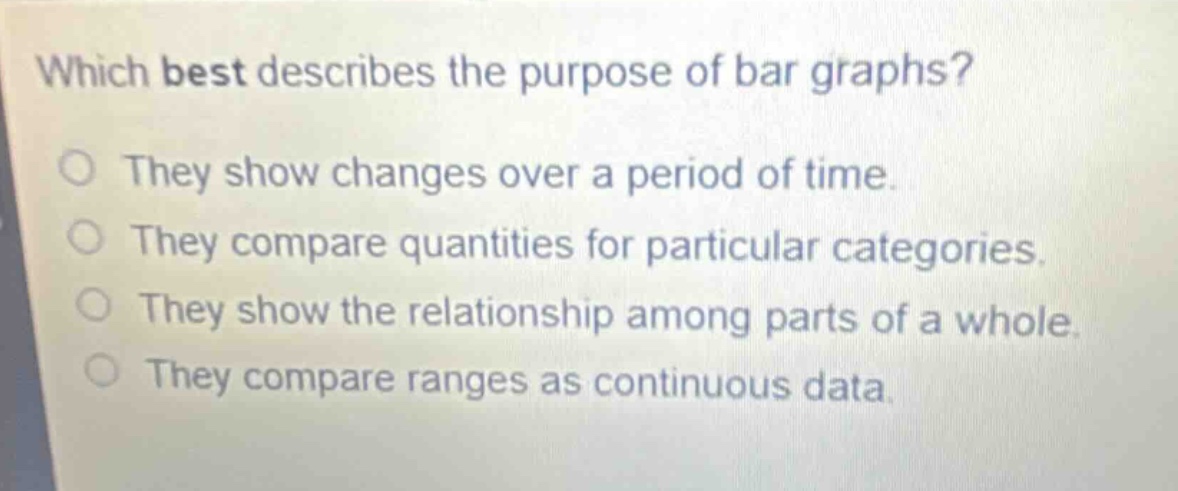
which best describes the purpose of bar graphs?\no they show changes over a period of time.\no they compare quantities for particular categories.\no they show the relationship among parts of a whole.\no they compare ranges as continuous data.
Answer
Brief Explanations:
Bar graphs use bars to represent data for different categories. Their main purpose is to visually compare the quantities of these categories. Line - graphs are better for showing changes over time, pie - charts for showing parts of a whole, and histograms for continuous data ranges.
Answer:
They compare quantities for particular categories.