which best describes the relationship between the number of soft drinks consumed per week and the age of the…
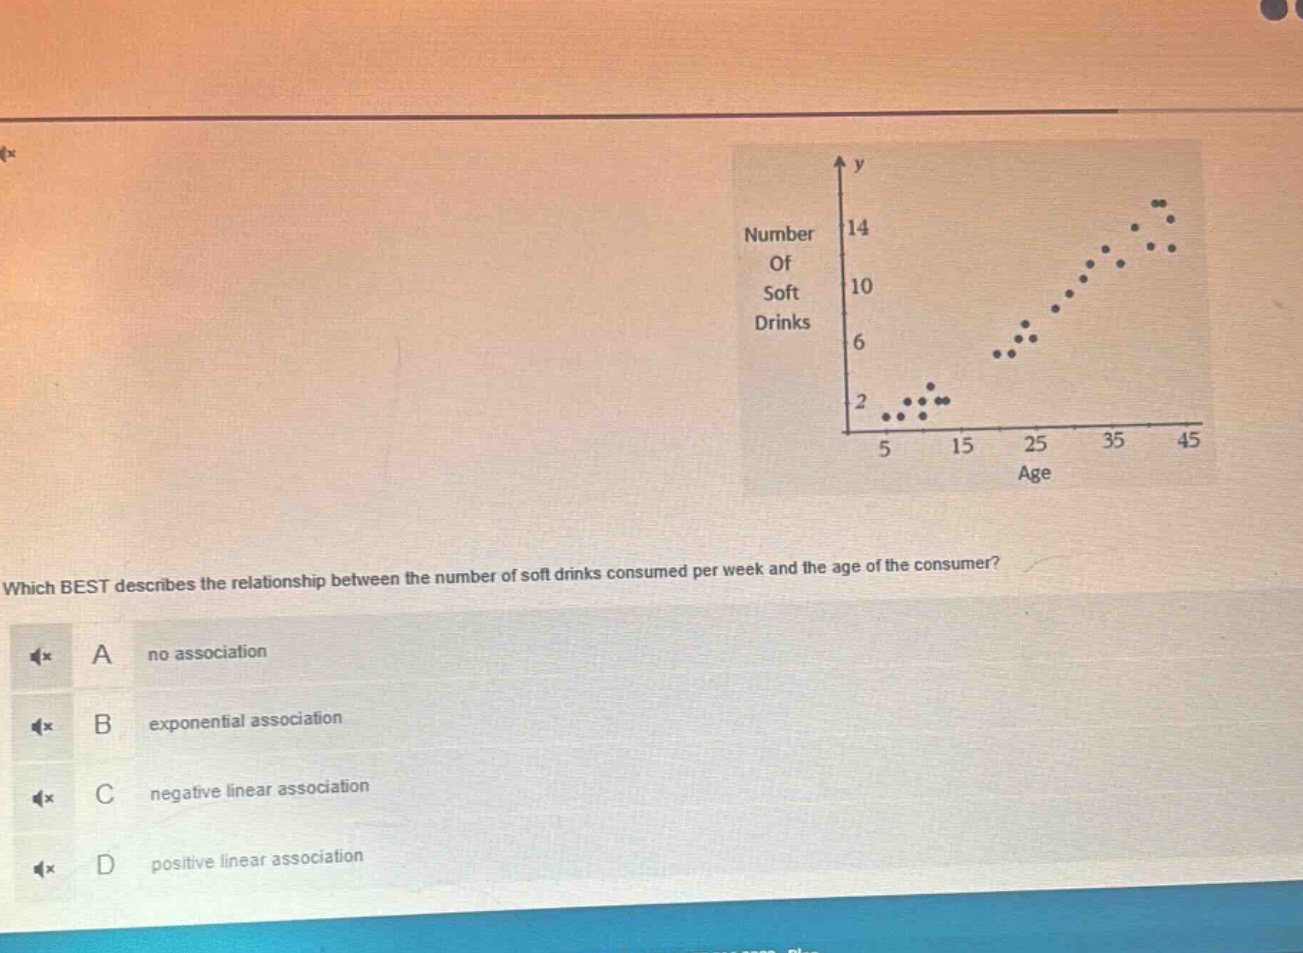
which best describes the relationship between the number of soft drinks consumed per week and the age of the consumer? a no association b exponential association c negative linear association d positive linear association
Answer
Answer:
D. positive linear association
Explanation:
Step1: Observe the scatter - plot
As age (x - axis) increases, the number of soft drinks (y - axis) generally increases.
Step2: Analyze the trend
The points seem to follow a linear - like pattern with an upward slope. This indicates a positive linear association.