what is the best description of this relationship? choose 1 answer: a positive linear association b negative…
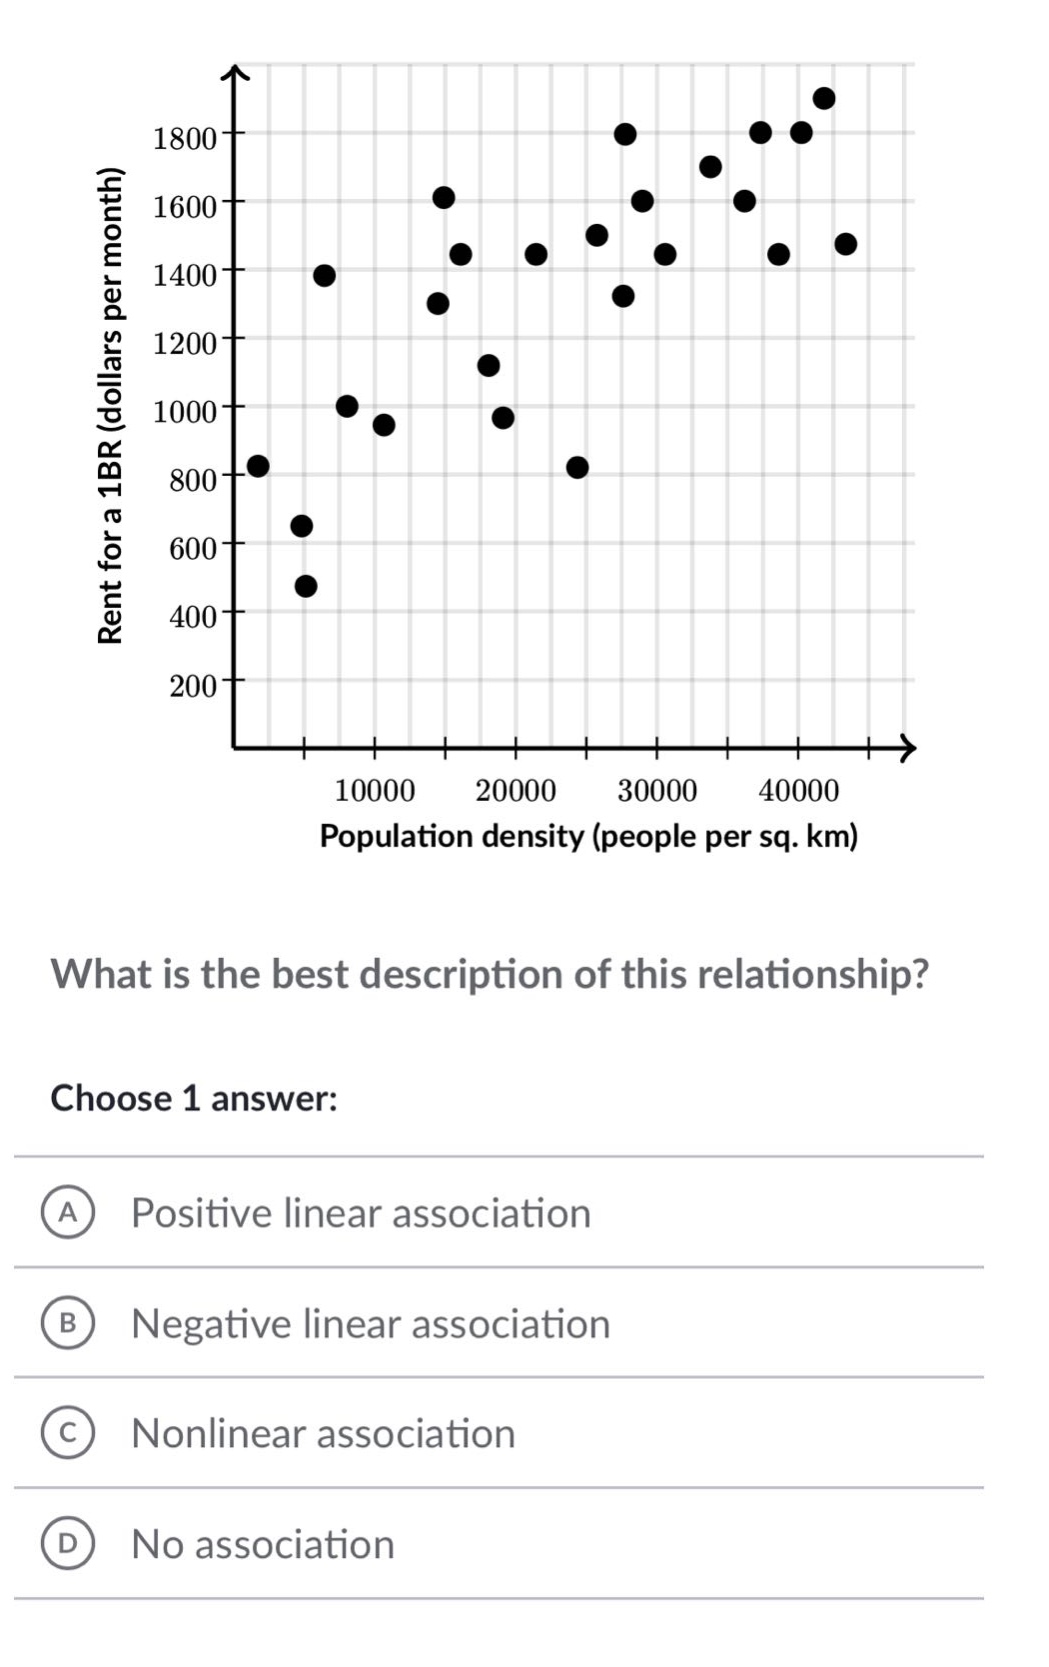
what is the best description of this relationship? choose 1 answer: a positive linear association b negative linear association c nonlinear association d no association
Answer
Answer:
A. Positive linear association
Explanation:
Step1: Observe the scatter - plot
As the population density (x - axis) increases, the rent for a 1BR (y - axis) generally increases.
Step2: Determine the type of association
The points seem to follow a somewhat straight - line pattern going upwards from left to right, which indicates a positive linear association.