what is the best estimate for the correlation coefficient of the data shown in the scatter plot?\na…
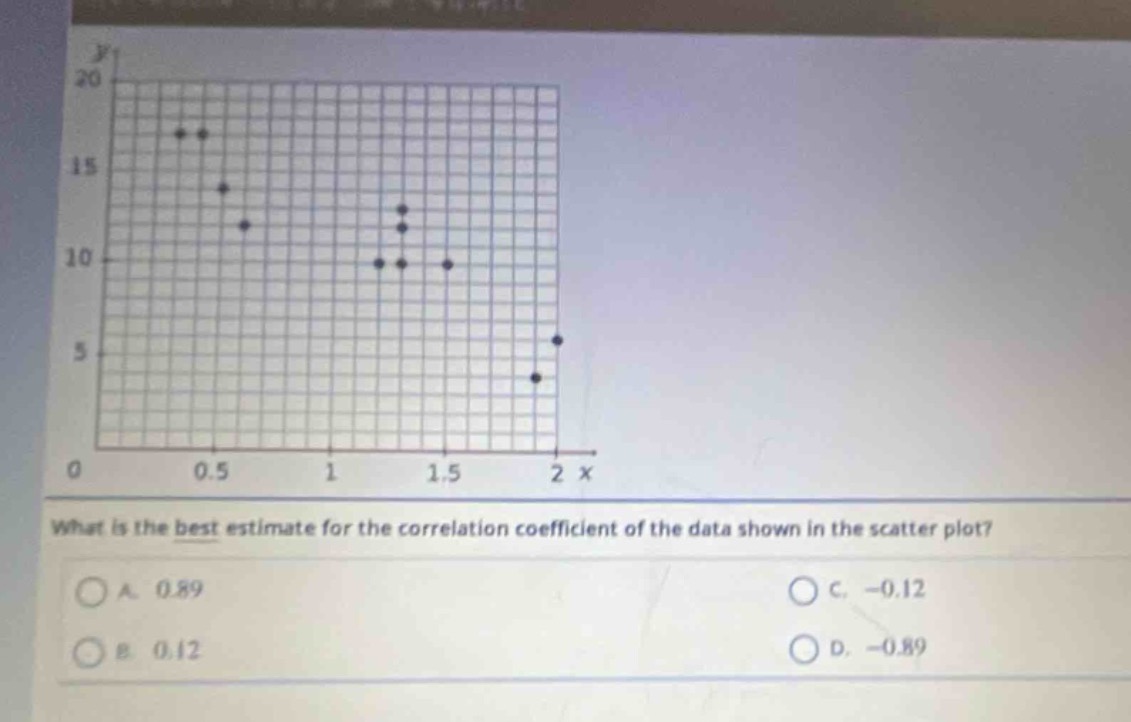
what is the best estimate for the correlation coefficient of the data shown in the scatter plot?\na. 0.89\nb. 0.12\nc. -0.12\nd. -0.89
Answer
Explanation:
Step1: Observe the scatter - plot trend
The points in the scatter - plot show a general downward trend. This indicates a negative correlation.
Step2: Assess the strength of the correlation
The points are somewhat scattered but still show a noticeable linear trend. A strong negative correlation has a correlation coefficient close to - 1, and a weak negative correlation has a coefficient close to 0. Since the points are not extremely tightly clustered around a line but still have a clear downward trend, the correlation coefficient should be moderately negative.
Answer:
D. - 0.89