which best explains how the histogram is useful for comparing the shapes of the data sets?\nit is easier to…
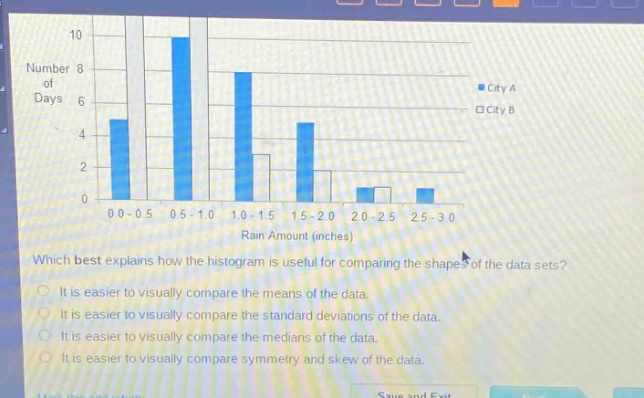
which best explains how the histogram is useful for comparing the shapes of the data sets?\nit is easier to visually compare the means of the data.\nit is easier to visually compare the standard deviations of the data.\nit is easier to visually compare the medians of the data.\nit is easier to visually compare symmetry and skew of the data.
Answer
Answer:
It is easier to visually compare symmetry and skew of the data.
Brief Explanations:
Histograms display data distribution shape, enabling visual assessment of symmetry and skew, which are key aspects of data shape.