which best represents the center of the data set below? 220 240 260 280 300 320 340 360 380 400 420 440…
which best represents the center of the data set below? 220 240 260 280 300 320 340 360 380 400 420 440 average monthly grocery bill mean median range mode
Answer
Explanation:
Step1: Understand data - set measures
The mean is the average value, the median is the middle - value when data is ordered, the range is the difference between the maximum and minimum values, and the mode is the most frequently occurring value. We want a measure of central tendency.
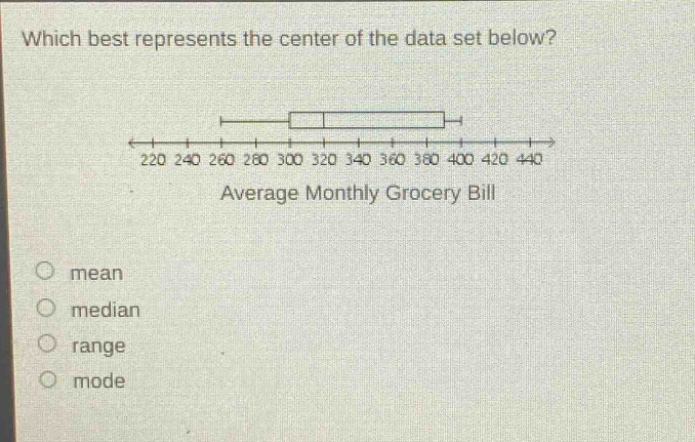
Step2: Analyze the box - plot
The box - plot shows a distribution of data. The median is represented by the line inside the box in a box - plot. In a box - plot, the median is a good measure of the center of the data set, especially when the data has outliers or is skewed. The mean can be affected by outliers, the range is a measure of spread not central tendency, and the mode is not easily identifiable from a box - plot.
Answer:
median