which is the best type of graph to model the speed of a roller coaster over the full two minutes it takes to…
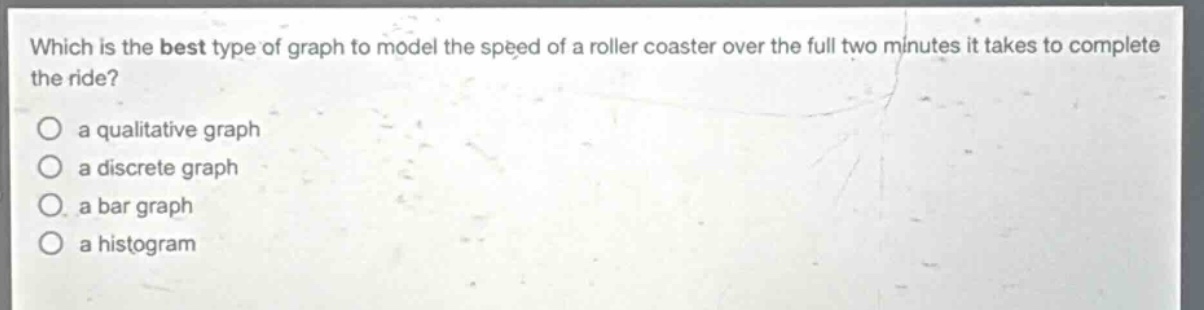
which is the best type of graph to model the speed of a roller coaster over the full two minutes it takes to complete the ride?\n○ a qualitative graph\n○ a discrete graph\n○ a bar graph\n○ a histogram
Answer
Brief Explanations:
A qualitative graph is best for showing continuous - changing data like the speed of a roller coaster over time. A discrete graph is for distinct, separate points. A bar graph is used to compare discrete categories. A histogram is for showing the distribution of continuous data in intervals. The speed of a roller coaster changes continuously over the two - minute ride, so a qualitative graph is most appropriate.
Answer:
a qualitative graph