which box plot correctly displays the data set with a maximum of 48, a minimum of 27, a median of 36, an…
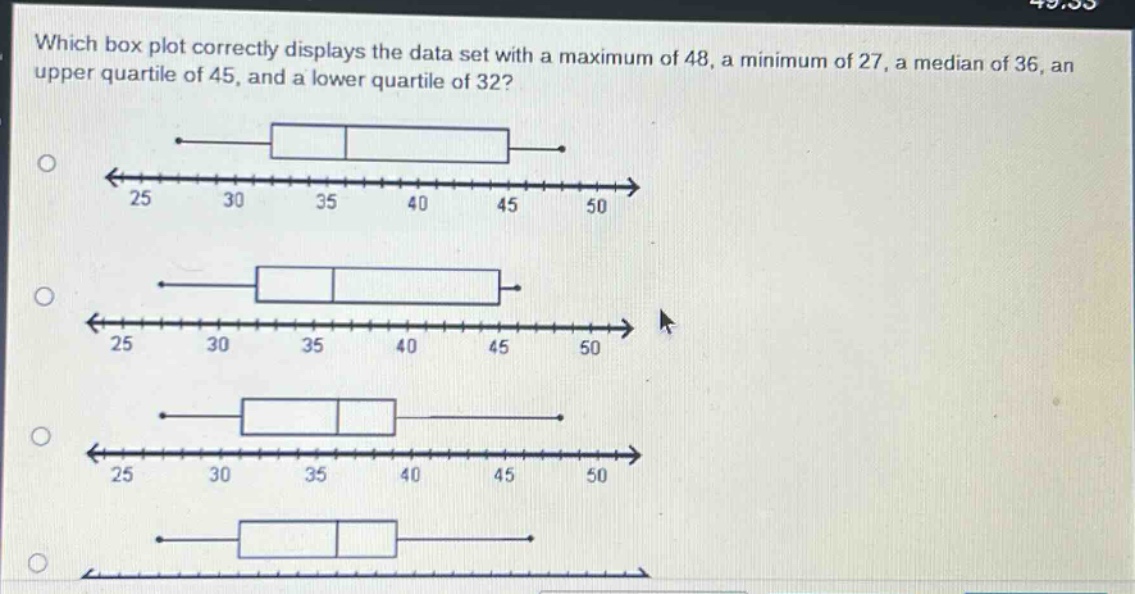
which box plot correctly displays the data set with a maximum of 48, a minimum of 27, a median of 36, an upper quartile of 45, and a lower quartile of 32?
Answer
Explanation:
Step1: Recall box - plot components
A box - plot has a minimum value represented by the left - most whisker end, a lower quartile ($Q_1$) represented by the left side of the box, a median ($Q_2$) represented by the line inside the box, an upper quartile ($Q_3$) represented by the right side of the box, and a maximum value represented by the right - most whisker end.
Step2: Check minimum value
The minimum value of the data set is 27. We need to find a box - plot where the left - most whisker end is at 27.
Step3: Check lower quartile
The lower quartile $Q_1 = 32$. We need to find a box - plot where the left side of the box is at 32.
Step4: Check median
The median $Q_2=36$. We need to find a box - plot where the line inside the box is at 36.
Step5: Check upper quartile
The upper quartile $Q_3 = 45$. We need to find a box - plot where the right side of the box is at 45.
Step6: Check maximum value
The maximum value of the data set is 48. We need to find a box - plot where the right - most whisker end is at 48.
Answer:
The box - plot that has the left - most whisker end at 27, the left side of the box at 32, the line inside the box at 36, the right side of the box at 45, and the right - most whisker end at 48 is the correct one. Without seeing the actual options clearly labeled, you would identify it based on these criteria. If we assume the options are labeled Option A, Option B, Option C, Option D from top to bottom, you would visually inspect each one to match the values: minimum = 27, $Q_1$ = 32, $Q_2$ = 36, $Q_3$ = 45, maximum = 48.