the box plot was created by using which pieces of data? an upper quartile of 56 and a median of 50 a lower…
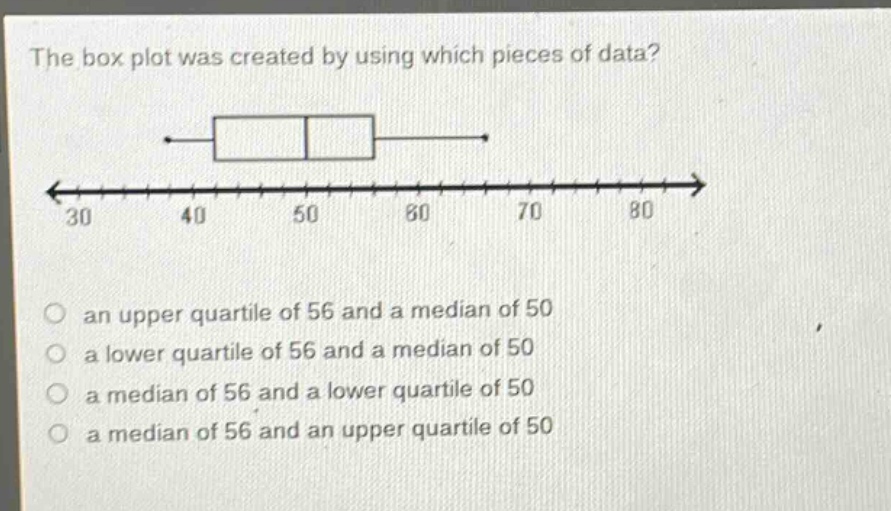
the box plot was created by using which pieces of data? an upper quartile of 56 and a median of 50 a lower quartile of 56 and a median of 50 a median of 56 and a lower quartile of 50 a median of 56 and an upper quartile of 50
Answer
Explanation:
Step1: Recall box - plot components
A box - plot has a box that represents the inter - quartile range. The line inside the box is the median. The left - hand side of the box is the lower quartile ($Q_1$) and the right - hand side of the box is the upper quartile ($Q_3$).
Step2: Identify values from the box - plot
In the given box - plot, the line inside the box is at 50, so the median is 50. The right - hand side of the box is at 56, so the upper quartile $Q_3 = 56$.
Answer:
an upper quartile of 56 and a median of 50