which box plot represents the data? 135, 149, 156, 112, 134, 141, 154, 116, 134, 156
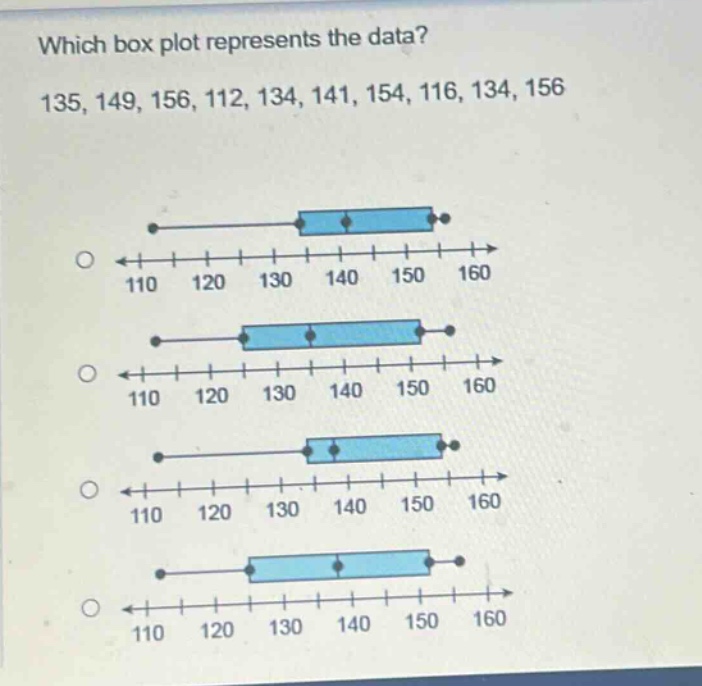
which box plot represents the data? 135, 149, 156, 112, 134, 141, 154, 116, 134, 156
Answer
Explanation:
Step1: Sort the data
$112, 116, 134, 134, 135, 141, 149, 154, 156, 156$
Step2: Find the minimum value
The minimum value is $112$.
Step3: Find the first - quartile ($Q_1$)
There are $n = 10$ data points. The position of $Q_1$ is $\frac{n + 1}{4}=\frac{10+ 1}{4}=2.75$. So, $Q_1=134$.
Step4: Find the median ($Q_2$)
The position of the median is $\frac{n+1}{2}=\frac{10 + 1}{2}=5.5$. So, $Q_2=\frac{135 + 141}{2}=138$.
Step5: Find the third - quartile ($Q_3$)
The position of $Q_3$ is $\frac{3(n + 1)}{4}=\frac{3\times(10 + 1)}{4}=8.25$. So, $Q_3=154$.
Step6: Find the maximum value
The maximum value is $156$.
The box - plot should have a minimum at $112$, $Q_1$ at $134$, median at $138$, $Q_3$ at $154$ and maximum at $156$.
Answer:
We need to visually inspect the box - plots to find the one with the minimum at $112$, $Q_1$ at $134$, median around $138$, $Q_3$ at $154$ and maximum at $156$. Without the ability to directly select from the visual options provided, the key values for the correct box - plot are: minimum = $112$, $Q_1=134$, median = $138$, $Q_3 = 154$, maximum = $156$.