which box plot represents the data set 2, 4, 6, 8, 10, 12?
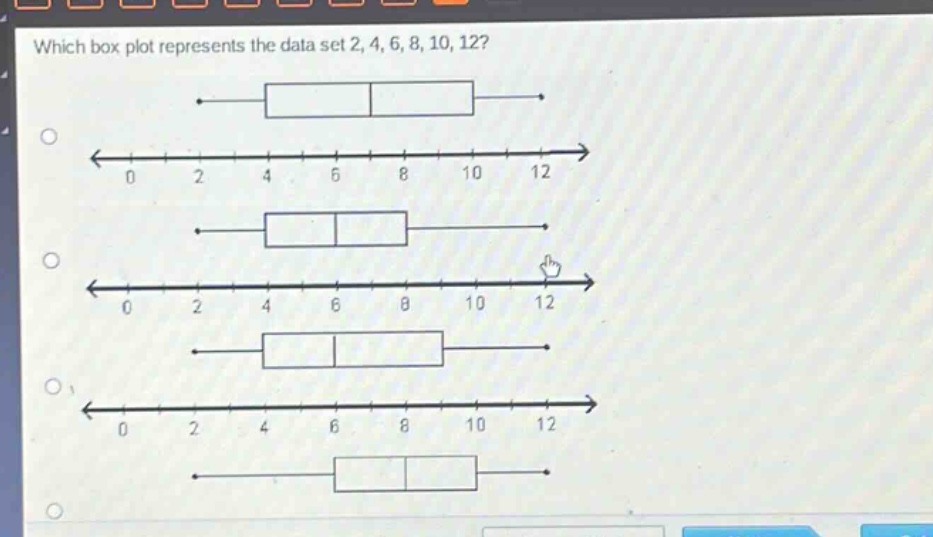
which box plot represents the data set 2, 4, 6, 8, 10, 12?
Answer
Explanation:
Step1: Find the minimum value
The minimum value in the data - set 2, 4, 6, 8, 10, 12 is 2.
Step2: Find the first quartile ($Q_1$)
Since there are $n = 6$ data points. The position of $Q_1$ is $\frac{n + 1}{4}=\frac{6+1}{4}=1.75$. Interpolating between the 1st and 2nd ordered data - points: $Q_1=2+(4 - 2)\times0.75 = 3.5$.
Step3: Find the median ($Q_2$)
The position of the median for $n = 6$ (an even - numbered data set) is $\frac{n}{2}=3$ and $\frac{n}{2}+1 = 4$. The median $Q_2=\frac{6 + 8}{2}=7$.
Step4: Find the third quartile ($Q_3$)
The position of $Q_3$ is $\frac{3(n + 1)}{4}=\frac{3\times(6 + 1)}{4}=5.25$. Interpolating between the 5th and 6th ordered data - points: $Q_3=10+(12 - 10)\times0.25 = 10.5$.
Step5: Find the maximum value
The maximum value in the data - set is 12.
The box in the box - plot should have the left - hand side at $Q_1 = 3.5$, the line inside the box at $Q_2=7$, and the right - hand side of the box at $Q_3 = 10.5$, with whiskers extending to 2 and 12.
Answer:
The box - plot with the left - hand side of the box at approximately 3.5, the line inside the box at 7, the right - hand side of the box at approximately 10.5, and whiskers extending to 2 and 12. (Since no specific labels are given for the box - plots in the image, a description based on the calculated values is provided).