the box plot below represents some data set. approximately what percentage of the data values are less than…
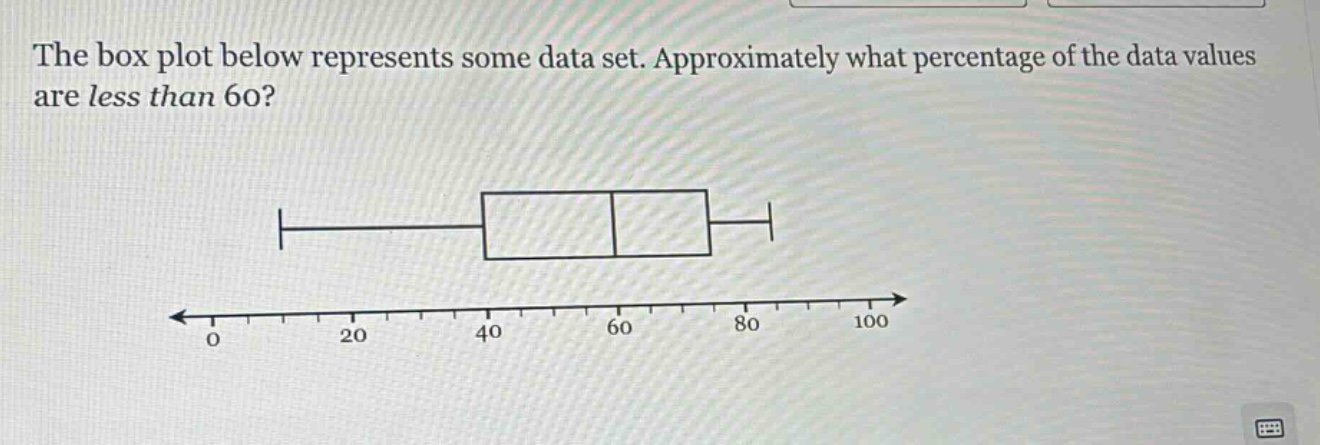
the box plot below represents some data set. approximately what percentage of the data values are less than 60?
Answer
Explanation:
Step1: Recall box - plot properties
In a box - plot, the box represents the inter - quartile range (IQR) with the left edge of the box being the first quartile ($Q_1$), the line inside the box being the median ($Q_2$), and the right edge of the box being the third quartile ($Q_3$). The whiskers extend to the minimum and maximum values within 1.5 * IQR of the box. Here, 60 is at the right - hand edge of the box, which is the third quartile ($Q_3$).
Step2: Use quartile percentage relationship
The first quartile ($Q_1$) represents the 25th percentile, the median ($Q_2$) represents the 50th percentile, and the third quartile ($Q_3$) represents the 75th percentile.
Answer:
75%