the box plot below represents some data set. approximately what percentage of the data values are less than…
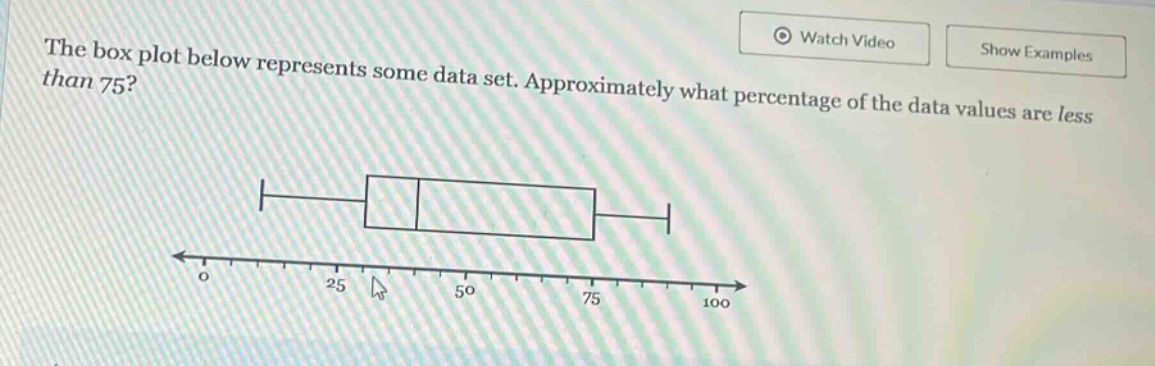
the box plot below represents some data set. approximately what percentage of the data values are less than 75?
Answer
Answer:
75%
Explanation:
Step1: Recall box - plot properties
In a box - plot, the third - quartile (Q3) marks the 75th percentile.
Step2: Identify Q3 on the box - plot
The value 75 on the box - plot is at Q3.
Step3: Determine the percentage
By definition, 75% of the data values are less than the third - quartile. So, approximately 75% of the data values are less than 75.