the box plot below represents some data set. what is the range of the data?
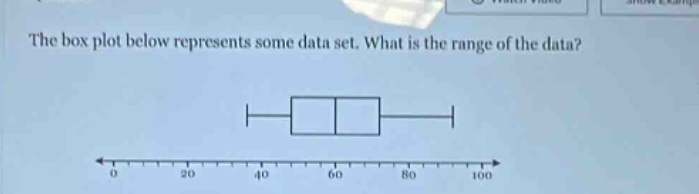
the box plot below represents some data set. what is the range of the data?
Answer
Explanation:
Step1: Identify maximum value
The maximum value in a box - plot is the end - point of the right - most whisker. Here, the maximum value is 100.
Step2: Identify minimum value
The minimum value in a box - plot is the end - point of the left - most whisker. Here, the minimum value is 0.
Step3: Calculate the range
The range is calculated as the difference between the maximum and minimum values. Range = Maximum - Minimum. So, Range = 100 - 0.
Answer:
100