the box plot represents the number of deer a wildlife biologist observes each day over the course of 7 days…
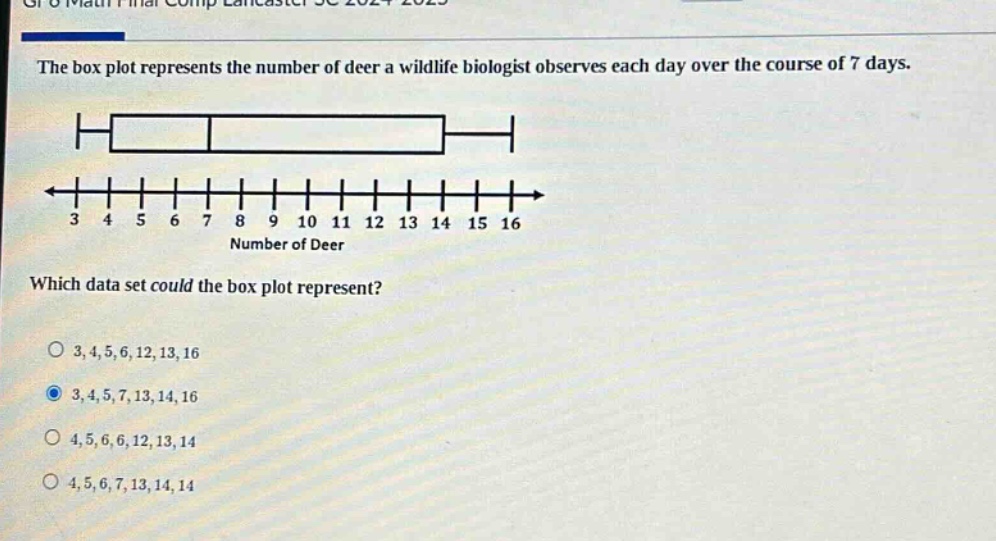
the box plot represents the number of deer a wildlife biologist observes each day over the course of 7 days. which data set could the box plot represent? 3,4,5,6,12,13,16 3,4,5,7,13,14,16 4,5,6,6,12,13,14 4,5,6,7,13,14,14
Answer
Explanation:
Step1: Recall box - plot properties
A box - plot shows the five - number summary: minimum, first quartile ($Q_1$), median, third quartile ($Q_3$), and maximum. For a data set with $n = 7$ data points, the median is the $\left(\frac{n + 1}{2}\right)$-th value, which is the 4th value when the data is ordered. $Q_1$ is the median of the lower half of the data (first 3 values when $n=7$) and $Q_3$ is the median of the upper half of the data (last 3 values when $n = 7$).
Step2: Analyze the minimum and maximum
The minimum value of the box - plot is 3 and the maximum is 16. So we can eliminate the data set $4,5,6,6,12,13,14$ since its minimum is 4.
Step3: Calculate the median
For a data set of 7 values, the median is the 4th value when ordered. For the data set $3,4,5,6,12,13,16$: Ordered data is $3,4,5,6,12,13,16$. Median is 6. For the data set $3,4,5,7,13,14,16$: Ordered data is $3,4,5,7,13,14,16$. Median is 7. For the data set $4,5,6,7,13,14,14$: Ordered data is $4,5,6,7,13,14,14$. Median is 7.
Step4: Calculate $Q_1$ and $Q_3$
For the data set $3,4,5,7,13,14,16$: The lower half is $3,4,5$. Median of lower half ($Q_1$) is 4. The upper half is $13,14,16$. Median of upper half ($Q_3$) is 14. The box - plot seems to have $Q_1$ around 4 - 5 and $Q_3$ around 13 - 14.