the box plot represents the number of math problems on the quizzes for an algebra course. number of math…
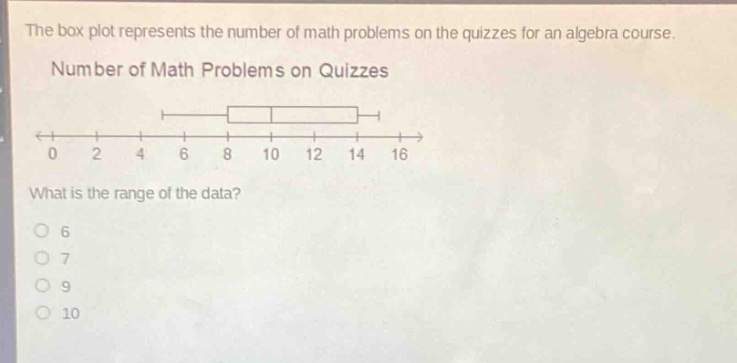
the box plot represents the number of math problems on the quizzes for an algebra course. number of math problems on quizzes\n0 2 4 6 8 10 12 14 16\nwhat is the range of the data?\n6\n7\n9\n10
Answer
Answer:
10
Explanation:
Step1: Identify minimum value
The minimum value from the box - plot is 6.
Step2: Identify maximum value
The maximum value from the box - plot is 16.
Step3: Calculate the range
Range = Maximum - Minimum = 16 - 6 = 10.