the box plot represents the number of minutes customers spend on hold when calling a company. number of…
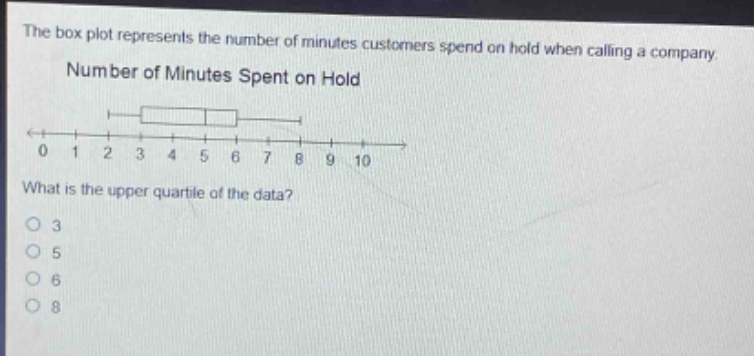
the box plot represents the number of minutes customers spend on hold when calling a company. number of minutes spent on hold 0 1 2 3 4 5 6 7 8 9 10 what is the upper quartile of the data? 3 5 6 8
Answer
Explanation:
Step1: Recall box - plot quartile positions
In a box - plot, the right - hand edge of the box represents the upper quartile ($Q_3$).
Step2: Identify the value
Looking at the box - plot, the right - hand edge of the box is at 6.
Answer:
6