the box plot represents the number of minutes customers spend on hold when calling a company. number of…
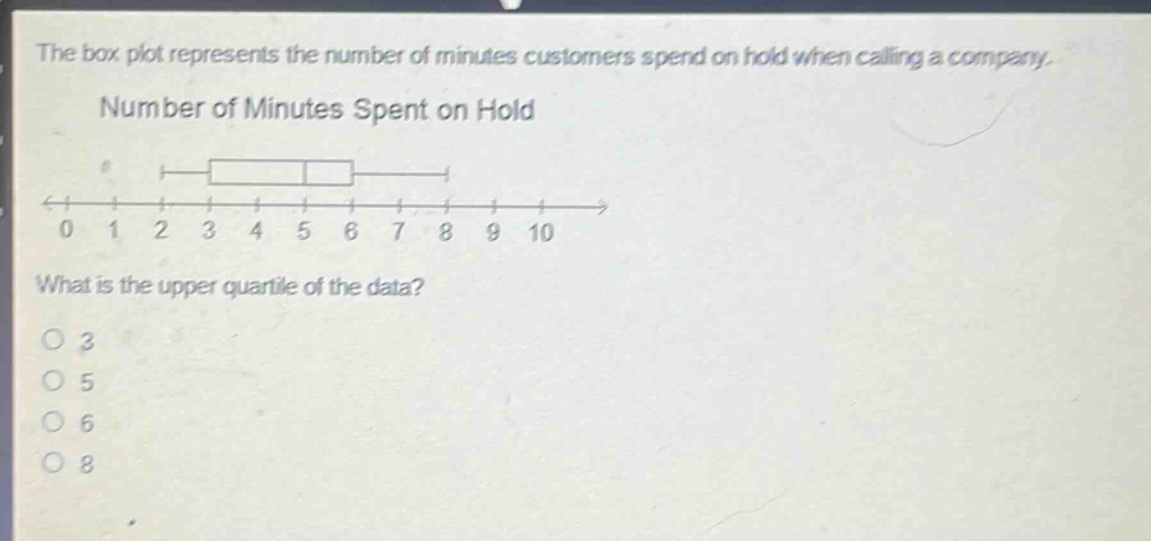
the box plot represents the number of minutes customers spend on hold when calling a company. number of minutes spent on hold\n0 1 2 3 4 5 6 7 8 9 10\nwhat is the upper quartile of the data?\no 3\no 5\no 6\no 8
Answer
Explanation:
Step1: Understand Box Plot Components
A box plot visually represents the five-number summary of a dataset: minimum, first quartile (Q1), median (Q2), third quartile (Q3), and maximum. The box itself spans from Q1 to Q3, with a line inside marking the median (Q2). The upper quartile (Q3) is the value below which 75% of the data fall.
Step2: Identify the Upper Quartile (Q3)
In a box plot, the upper quartile (Q3) is indicated by the right edge of the rectangular box.
Step3: Read the Value from the Plot
Looking at the provided box plot, the right edge of the box aligns with the value 6 on the horizontal axis. Therefore, the upper quartile of the data is 6.
Answer:
6