the box - plot shows the number of raisins found in sample boxes from brand c and from brand d. each box…
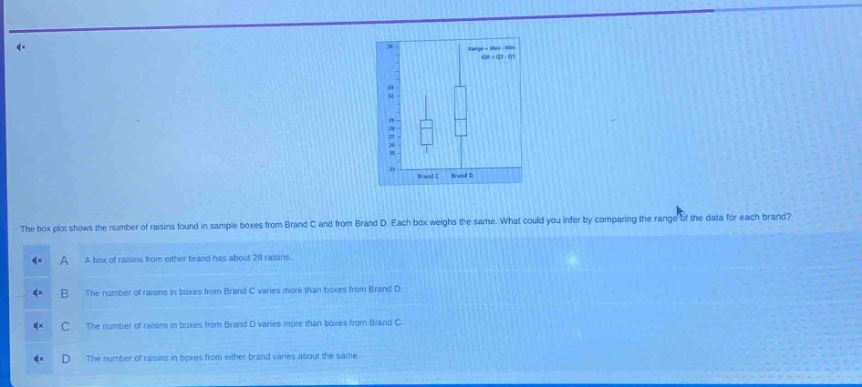
the box - plot shows the number of raisins found in sample boxes from brand c and from brand d. each box weighs the same. what could you infer by comparing the range of the data for each brand?\na a box of raisins from either brand has about 28 raisins.\nb the number of raisins in boxes from brand c varies more than boxes from brand d.\nc the number of raisins in boxes from brand d varies more than boxes from brand c.\nd the number of raisins in boxes from either brand varies about the same.
Answer
Explanation:
Step1: Recall range definition
The range is the difference between the maximum and minimum values in a data - set. In a box - plot, the range is the length from the end of the left - most whisker to the end of the right - most whisker.
Step2: Observe box - plots
By looking at the box - plots of Brand C and Brand D, we can see that the length of the box - plot (which represents the range) for Brand D is larger than that of Brand C. This means that the difference between the maximum and minimum number of raisins in Brand D boxes is greater than the difference between the maximum and minimum number of raisins in Brand C boxes.
Answer:
C. The number of raisins in boxes from Brand D varies more than boxes from Brand C.