the box plot summarizes the number of people enrolling in fitness classes each month during one year at the…
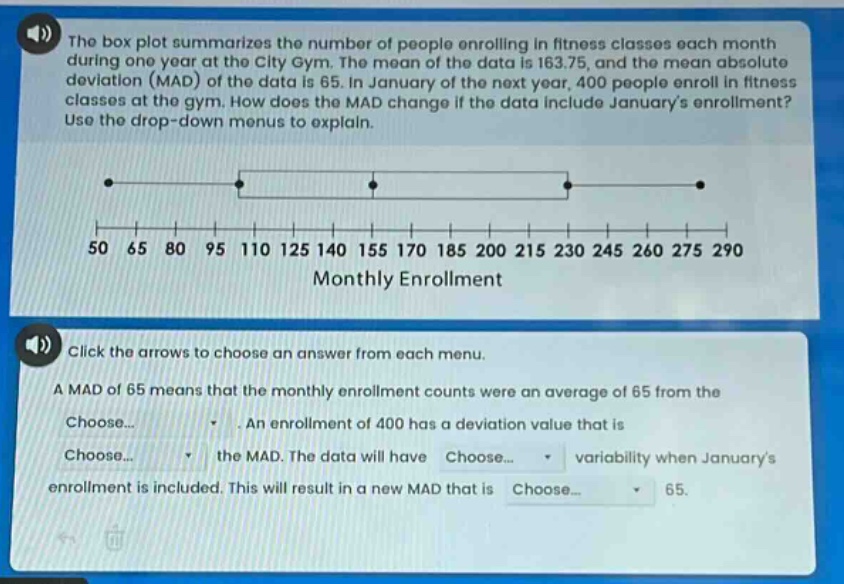
the box plot summarizes the number of people enrolling in fitness classes each month during one year at the city gym. the mean of the data is 163.75, and the mean absolute deviation (mad) of the data is 65. in january of the next year, 400 people enroll in fitness classes at the gym. how does the mad change if the data include januarys enrollment? use the drop - down menus to explain. click the arrows to choose an answer from each menu. a mad of 65 means that the monthly enrollment counts were an average of 65 from the choose... . an enrollment of 400 has a deviation value that is choose... the mad. the data will have choose... variability when januarys enrollment is included. this will result in a new mad that is choose... 65.
Answer
Explanation:
Step1: Recall MAD meaning
MAD is average distance from mean. So a MAD of 65 means monthly enrollment counts were an average of 65 from the mean.
Step2: Calculate deviation of 400
The mean is 163.75. Deviation of 400 from mean is (|400 - 163.75|=236.25). Since (236.25>65), an enrollment of 400 has a deviation value that is greater than the MAD.
Step3: Analyze variability
The value 400 is an out - lier. When an out - lier is included in the data set, the data will have greater variability.
Step4: Determine new MAD
Greater variability means a larger average distance from the mean. So the new MAD will be greater than 65.
Answer:
A MAD of 65 means that the monthly enrollment counts were an average of 65 from the mean. An enrollment of 400 has a deviation value that is greater than the MAD. The data will have greater variability when January's enrollment is included. This will result in a new MAD that is greater than 65.