the box plots compare the number of students in mr. ishimotos classes and in ms. castillos classes over the…
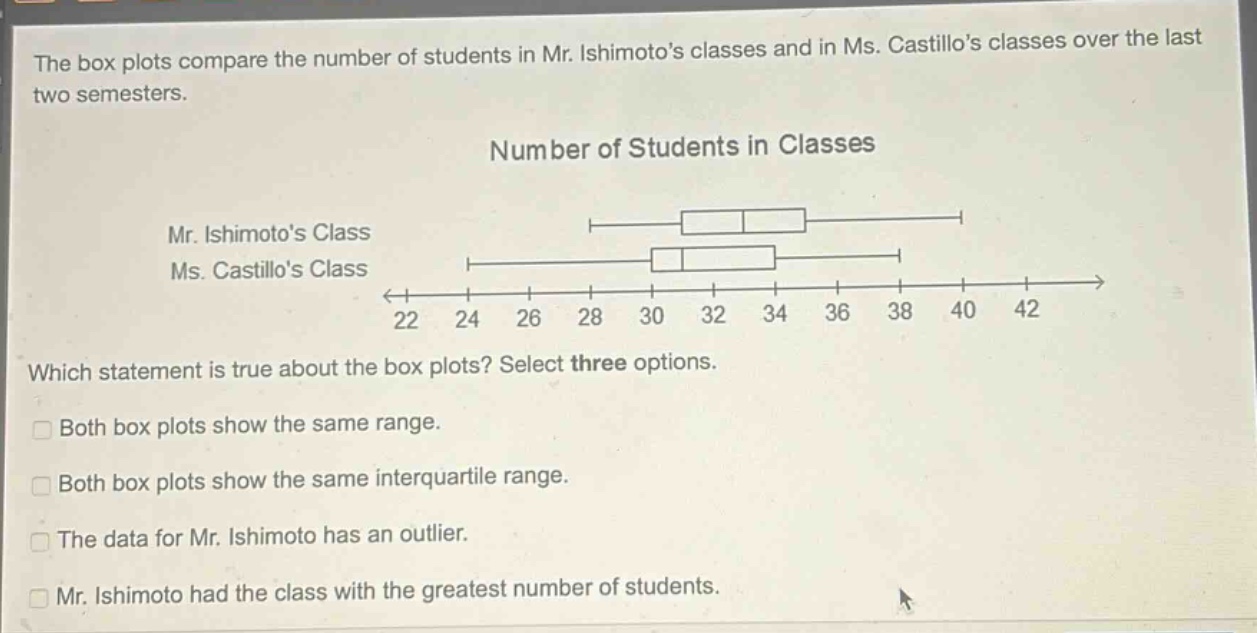
the box plots compare the number of students in mr. ishimotos classes and in ms. castillos classes over the last two semesters. number of students in classes mr. ishimotos class ms. castillos class which statement is true about the box plots? select three options. both box plots show the same range. both box plots show the same interquartile range. the data for mr. ishimoto has an outlier. mr. ishimoto had the class with the greatest number of students.
Answer
Explanation:
Step1: Calculate IQR for Mr. Ishimoto's class.
From the box plot, $Q_1 = 31$ and $Q_3 = 35$. $IQR_{Ishimoto} = Q_3 - Q_1 = 35 - 31 = 4$
Step2: Calculate IQR for Ms. Castillo's class and compare.
From the box plot, $Q_1 = 30$ and $Q_3 = 34$. $IQR_{Castillo} = Q_3 - Q_1 = 34 - 30 = 4$ Since $IQR_{Ishimoto} = IQR_{Castillo} = 4$, the statement "Both box plots show the same interquartile range" is true.
Step3: Find the maximum value for Mr. Ishimoto's class.
The right whisker extends to 40. $Max_{Ishimoto} = 40$
Step4: Find the maximum value for Ms. Castillo's class and compare.
The right whisker extends to 38. $Max_{Castillo} = 38$ Since $Max_{Ishimoto} (40) > Max_{Castillo} (38)$, the statement "Mr. Ishimoto had the class with the greatest number of students" is true.
Step5: Calculate the range for Mr. Ishimoto's class.
The left whisker extends to 28 (Minimum). $Range_{Ishimoto} = Max_{Ishimoto} - Min_{Ishimoto} = 40 - 28 = 12$
Step6: Calculate the range for Ms. Castillo's class and compare.
The left whisker extends to 24 (Minimum). $Range_{Castillo} = Max_{Castillo} - Min_{Castillo} = 38 - 24 = 14$ Since $Range_{Ishimoto} (12) \neq Range_{Castillo} (14)$, the statement "Both box plots show the same range" is false.
Step7: Calculate outlier fences for Mr. Ishimoto's class.
Lower Fence = $Q_1 - 1.5 \times IQR = 31 - 1.5 \times 4 = 31 - 6 = 25$ Upper Fence = $Q_3 + 1.5 \times IQR = 35 + 1.5 \times 4 = 35 + 6 = 41$
Step8: Check Mr. Ishimoto's data for outliers.
Mr. Ishimoto's minimum value is 28, which is greater than the Lower Fence (25). Mr. Ishimoto's maximum value is 40, which is less than the Upper Fence (41). There are no data points outside the fences, so there are no outliers. The statement "The data for Mr. Ishimoto has an outlier" is false.
Step9: Select the true statements.
Based on the calculations, only two statements are true: "Both box plots show the same interquartile range" and "Mr. Ishimoto had the class with the greatest number of students." The question asks to select three options, indicating a potential issue with the question or options provided. We list the two demonstrably true statements.
Answer:
Both box plots show the same interquartile range. Mr. Ishimoto had the class with the greatest number of students.