the box plots compare the number of students in mr. ishimotos classes and in ms. castillos classes over the…
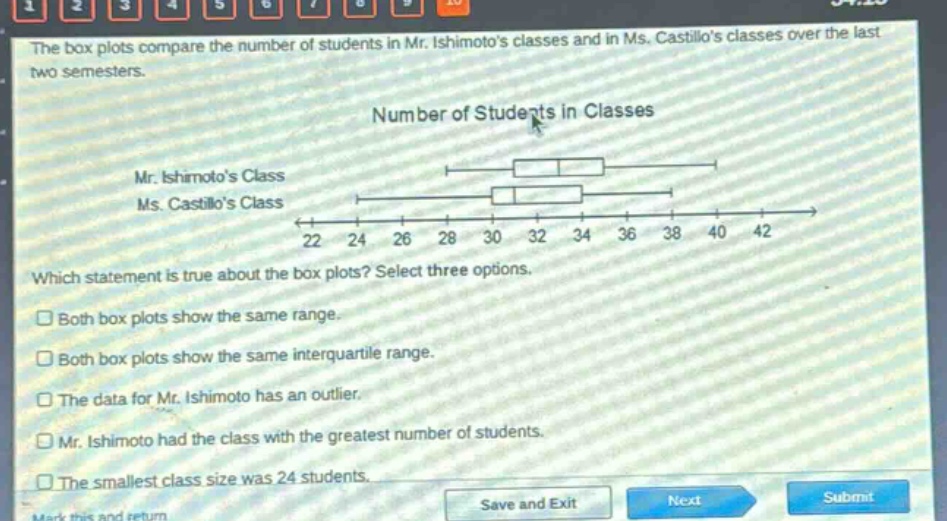
the box plots compare the number of students in mr. ishimotos classes and in ms. castillos classes over the last two semesters. number of students in classes mr. ishimotos class ms. castillos class 22 24 26 28 30 32 34 36 38 40 42 which statement is true about the box plots? select three options. both box plots show the same range. both box plots show the same interquartile range. the data for mr. ishimoto has an outlier. mr. ishimoto had the class with the greatest number of students. the smallest class size was 24 students.
Answer
Explanation:
Step1: Calculate range for Mr. Ishimoto
Range = Max - Min. For Mr. Ishimoto, Max = 40, Min = 24, so range = 40 - 24 = 16.
Step2: Calculate range for Ms. Castillo
For Ms. Castillo, Max = 38, Min = 24, so range = 38 - 24 = 14. So the ranges are not the same.
Step3: Calculate inter - quartile range (IQR) for Mr. Ishimoto
IQR = Q3 - Q1. For Mr. Ishimoto, Q1 = 28, Q3 = 36, so IQR = 36 - 28 = 8.
Step4: Calculate inter - quartile range (IQR) for Ms. Castillo
For Ms. Castillo, Q1 = 28, Q3 = 36, so IQR = 36 - 28 = 8. The IQRs are the same.
Step5: Check for outliers
There are no dots outside the whiskers in Mr. Ishimoto's box - plot, so no outlier.
Step6: Find the maximum value
The maximum value for Mr. Ishimoto is 40 and for Ms. Castillo is 38. So Mr. Ishimoto had the class with the greatest number of students.
Step7: Find the minimum value
The minimum value for both is 24. So the smallest class size was 24 students.
Answer:
- Both box plots show the same interquartile range.
- Mr. Ishimoto had the class with the greatest number of students.
- The smallest class size was 24 students.