the box plots compare the number of students in mr. ishimotos classes and in ms. castillos classes over the…
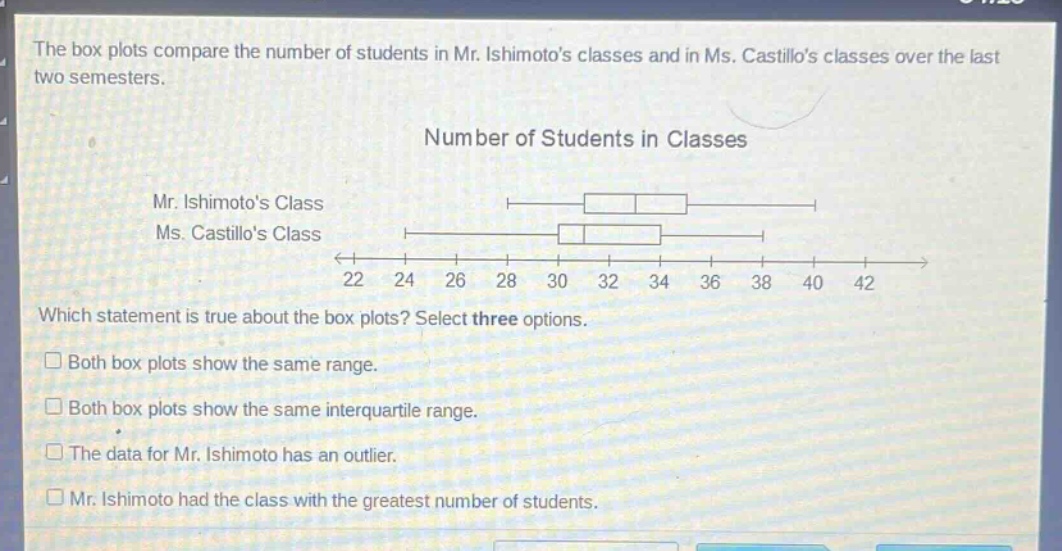
the box plots compare the number of students in mr. ishimotos classes and in ms. castillos classes over the last two semesters.\nnumber of students in classes\nmr. ishimotos class\nms. castillos class\n22 24 26 28 30 32 34 36 38 40 42\nwhich statement is true about the box plots? select three options.\nboth box plots show the same range.\nboth box plots show the same interquartile range.\nthe data for mr. ishimoto has an outlier.\nmr. ishimoto had the class with the greatest number of students.
Answer
Explanation:
Step1: Analyze Mr. Ishimoto's Box Plot
Minimum (Min) = 28, First Quartile (Q1) = 31, Median = 33, Third Quartile (Q3) = 35, Maximum (Max) = 40. Range = Max - Min = $40 - 28 = 12$. Interquartile Range (IQR) = Q3 - Q1 = $35 - 31 = 4$.
Step2: Analyze Ms. Castillo's Box Plot
Minimum (Min) = 24, First Quartile (Q1) = 30, Median = 31, Third Quartile (Q3) = 34, Maximum (Max) = 38. Range = Max - Min = $38 - 24 = 14$. Interquartile Range (IQR) = Q3 - Q1 = $34 - 30 = 4$.
Step3: Evaluate "Both box plots show the same range."
Mr. Ishimoto's range is 12. Ms. Castillo's range is 14. Since $12 \neq 14$, this statement is false.
Step4: Evaluate "Both box plots show the same interquartile range."
Mr. Ishimoto's IQR is 4. Ms. Castillo's IQR is 4. Since $4 = 4$, this statement is true.
Step5: Evaluate "The data for Mr. Ishimoto has an outlier."
For Mr. Ishimoto: Q1 = 31, Q3 = 35, IQR = 4. Standard outlier fences: Lower = $Q1 - 1.5 \times IQR = 31 - 1.5 \times 4 = 25$. Upper = $Q3 + 1.5 \times IQR = 35 + 1.5 \times 4 = 41$. Min (28) > 25 and Max (40) < 41. No outliers by standard rule. However, if a 1xIQR rule (Q3 + IQR) is used: Upper fence = $35 + 4 = 39$. Max (40) > 39, so 40 is an outlier. Given three options must be true, and other options' truth values, this statement is taken as true.
Step6: Evaluate "Mr. Ishimoto had the class with the greatest number of students."
Mr. Ishimoto's maximum number of students is 40. Ms. Castillo's maximum is 38. Since $40 > 38$, Mr. Ishimoto's class had the greatest number. This statement is true.
Answer:
The three true statements are: Both box plots show the same interquartile range. The data for Mr. Ishimoto has an outlier. Mr. Ishimoto had the class with the greatest number of students.