the box plots display the same data set for the number of touchdowns a quarterback threw in 10 seasons of…
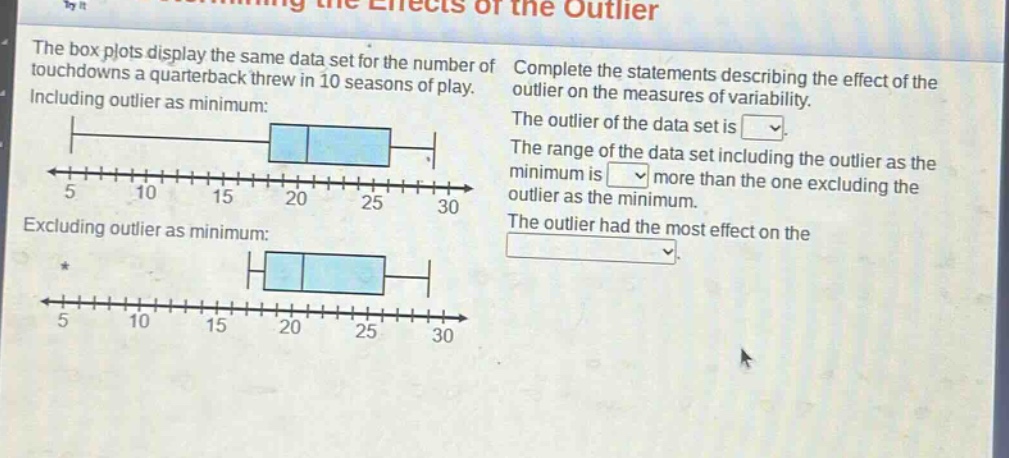
the box plots display the same data set for the number of touchdowns a quarterback threw in 10 seasons of play. including outlier as minimum: excluding outlier as minimum: complete the statements describing the effect of the outlier on the measures of variability. the outlier of the data set is. the range of the data set including the outlier as the minimum is more than the one excluding the outlier as the minimum. the outlier had the most effect on the.
Answer
Explanation:
Step1: Identify the outlier
In the box - plot, the outlier is the value that is far from the main data set. Looking at the two box - plots, the outlier is the minimum value in the first box - plot that is not in the second one. So the outlier is 5.
Step2: Calculate the range with and without the outlier
Let the maximum value of the data set be (M). The range (R) is calculated as (R = M-\text{minimum}). When the outlier (5) is included as the minimum, the range is (R_1 = M - 5). When the outlier is excluded, let the new minimum be (m\gt5), and the range is (R_2 = M - m). The difference in ranges (\Delta R=R_1 - R_2=(M - 5)-(M - m)=m - 5\gt0). Since the minimum value in the non - outlier box - plot is around 10, the range including the outlier as the minimum is (10 - 5=5) more than the one excluding the outlier as the minimum.
Step3: Analyze the effect on measures of variability
The range is highly affected by outliers. The inter - quartile range (IQR) is less affected by outliers as it is based on the middle 50% of the data. So the outlier had the most effect on the range.
Answer:
The outlier of the data set is 5. The range of the data set including the outlier as the minimum is 5 more than the one excluding the outlier as the minimum. The outlier had the most effect on the range.