the box plots represent the ages of pennies in two 50 - cent rolls. ages of pennies roll 1 roll 2 0 2 4 6 8…
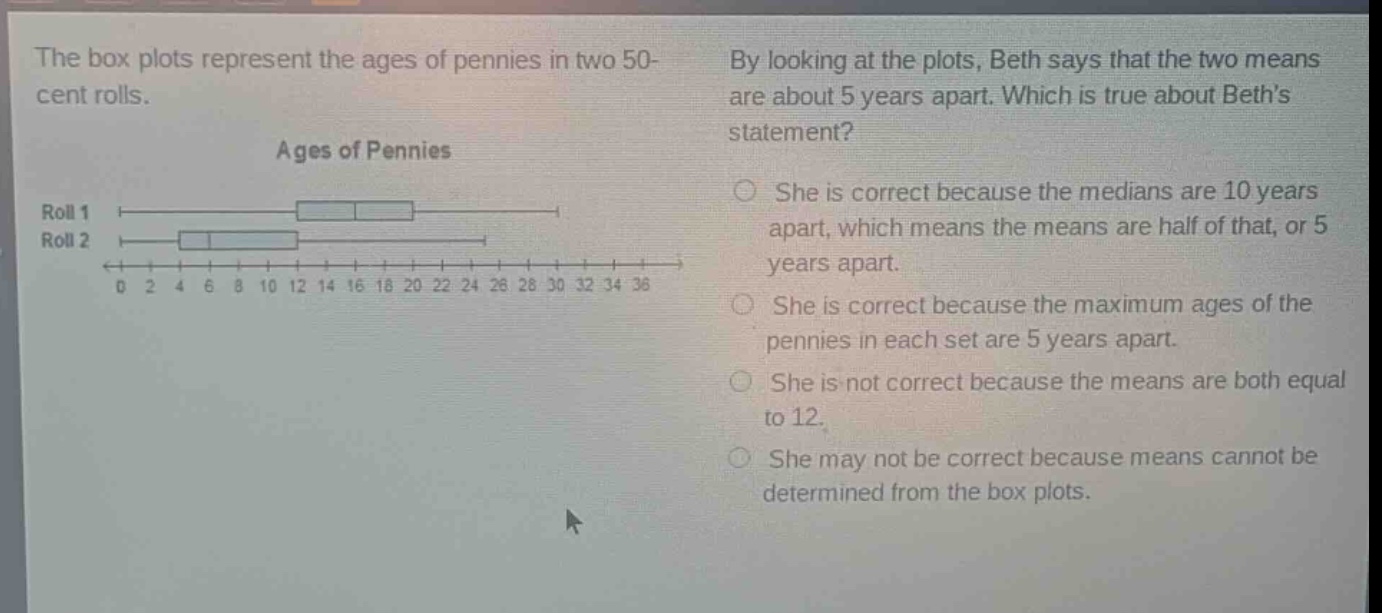
the box plots represent the ages of pennies in two 50 - cent rolls. ages of pennies roll 1 roll 2 0 2 4 6 8 10 12 14 16 18 20 22 24 26 28 30 32 34 36 by looking at the plots, beth says that the two means are about 5 years apart. which is true about beths statement? she is correct because the medians are 10 years apart, which means the means are half of that, or 5 years apart. she is correct because the maximum ages of the pennies in each set are 5 years apart. she is not correct because the means are both equal to 12. she may not be correct because means cannot be determined from the box plots.
Answer
Answer:
She may not be correct because means cannot be determined from the box plots.
Explanation:
Step1: Understand box - plot information
Box - plots show median, quartiles, minimum, and maximum.
Step2: Analyze mean determination
Mean is the sum of all data values divided by the number of data points. Box - plots do not provide individual data values, so means cannot be determined from box - plots.