the box plots represent the ages of pennies in two 50 - cent rolls. by looking at the plots, beth says that…
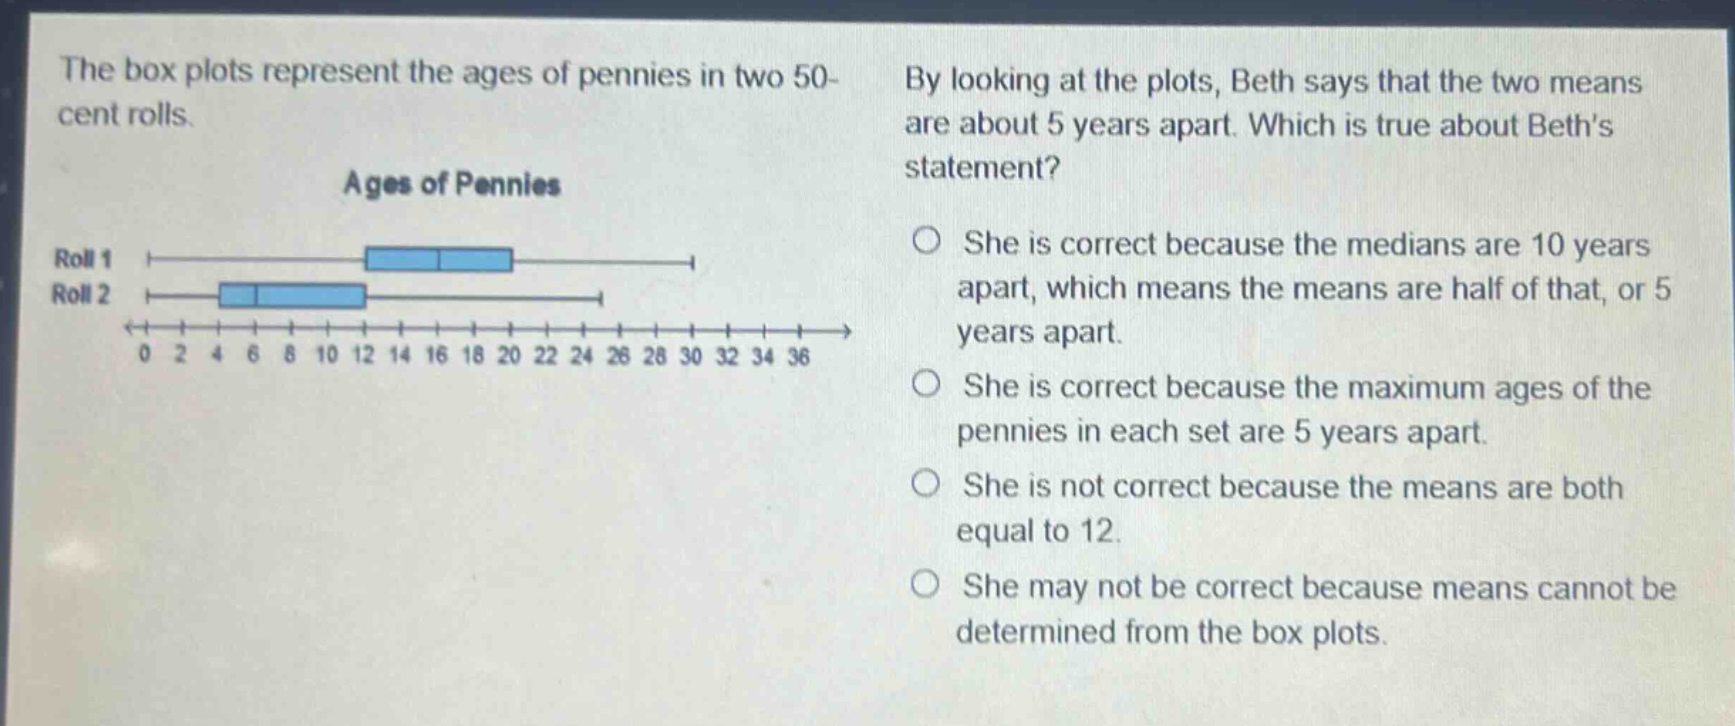
the box plots represent the ages of pennies in two 50 - cent rolls. by looking at the plots, beth says that the two means are about 5 years apart. which is true about beths statement? ages of pennies roll 1 roll 2 0 2 4 6 8 10 12 14 16 18 20 22 24 26 28 30 32 34 36 she is correct because the medians are 10 years apart, which means the means are half of that, or 5 years apart. she is correct because the maximum ages of the pennies in each set are 5 years apart. she is not correct because the means are both equal to 12. she may not be correct because means cannot be determined from the box plots.
Answer
Brief Explanations:
A box - plot shows the five - number summary (minimum, first quartile, median, third quartile, maximum) of a data set. It does not provide direct information about the mean of the data set. Just because we know the median, maximum or other values from the box - plot, we cannot accurately determine the means and their difference.
Answer:
She may not be correct because means cannot be determined from the box plots.