the box plots represent daytime high temperatures during the month of april in two cities. which of the…
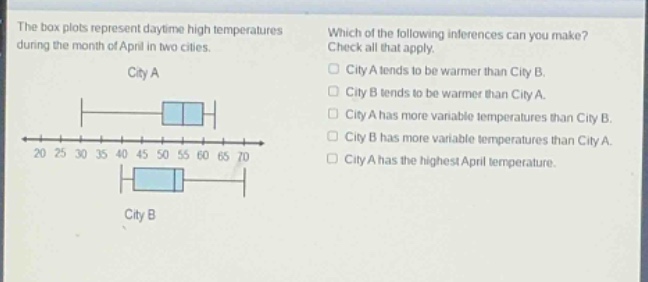
the box plots represent daytime high temperatures during the month of april in two cities. which of the following inferences can you make? check all that apply. city a tends to be warmer than city b. city b tends to be warmer than city a. city a has more variable temperatures than city b. city b has more variable temperatures than city a. city a has the highest april temperature.
Answer
Explanation:
Step1: Analyze median position
The median of City A is around 55 and of City B is around 45. Since 55 > 45, City A has a higher - median temperature, so City A tends to be warmer.
Step2: Analyze inter - quartile range (IQR)
The IQR of City A (distance between Q1 and Q3) is smaller than that of City B. A larger IQR indicates more variability. So City B has more variable temperatures.
Step3: Analyze maximum values
The maximum value for City A is around 65 and for City B is around 55. So City A has the highest April temperature.
Answer:
City A tends to be warmer than City B. City B has more variable temperatures than City A. City A has the highest April temperature.