the box plots below show the ages of college students in different math courses. 16 17 18 19 20 21 22 math 1…
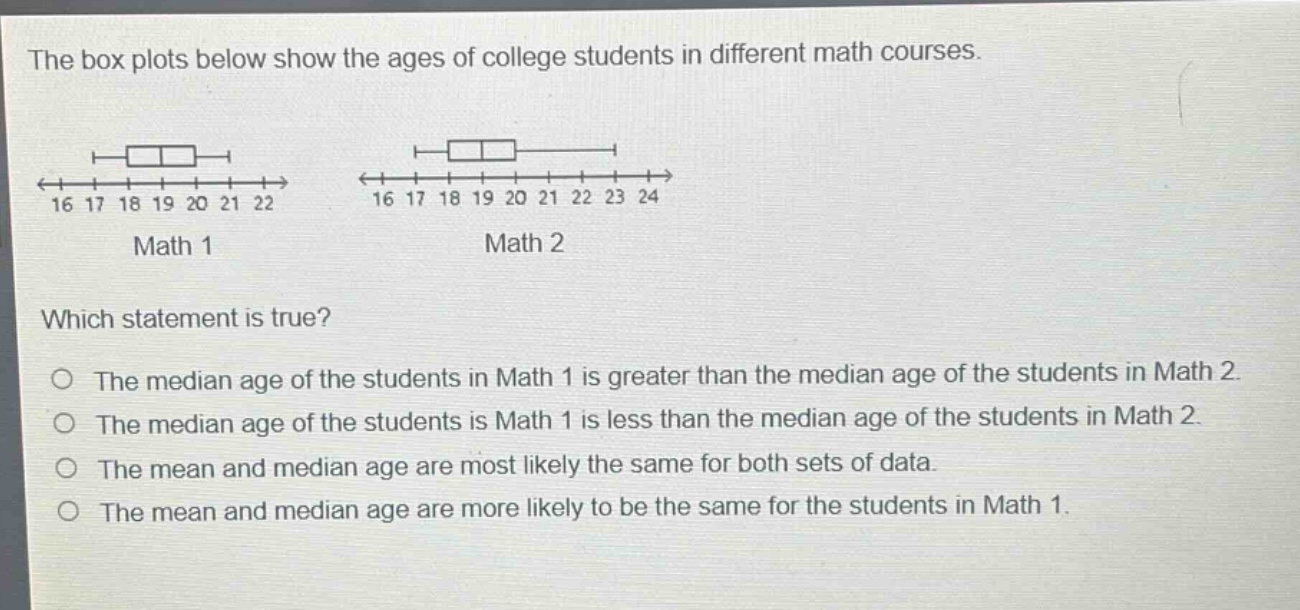
the box plots below show the ages of college students in different math courses. 16 17 18 19 20 21 22 math 1 16 17 18 19 20 21 22 23 24 math 2 which statement is true? the median age of the students in math 1 is greater than the median age of the students in math 2. the median age of the students is math 1 is less than the median age of the students in math 2. the mean and median age are most likely the same for both sets of data. the mean and median age are more likely to be the same for the students in math 1.
Answer
Explanation:
Step1: Identify median in box - plot
The line inside the box of a box - plot represents the median. For Math 1, the median is at 19. For Math 2, the median is at 20.
Step2: Compare medians
Since 19 < 20, the median age of the students in Math 1 is less than the median age of the students in Math 2.
Answer:
The median age of the students is Math 1 is less than the median age of the students in Math 2.