the box plots show the amount of snow in the towns of northcrest and grandmont for the first 10 snowfalls of…
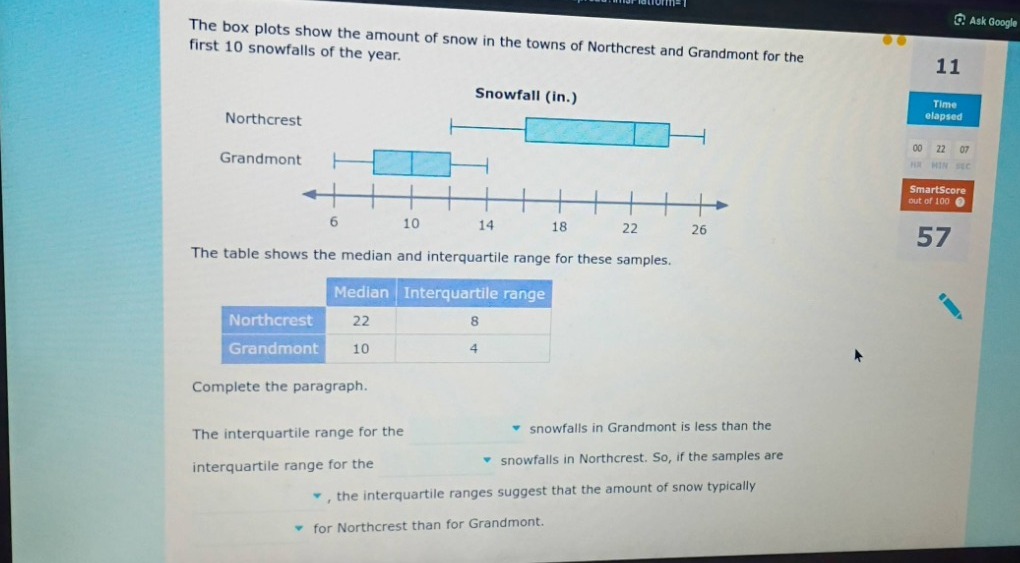
the box plots show the amount of snow in the towns of northcrest and grandmont for the first 10 snowfalls of the year.\nsnowfall (in.)\nnorthcrest\ngrandmont\n6 10 14 18 22 26\nthe table shows the median and interquartile range for these samples.\nmedian | interquartile range\nnorthcrest | 22 | 8\ngrandmont | 10 | 4\ncomplete the paragraph.\nthe interquartile range for the snowfalls in grandmont is less than the interquartile range for the snowfalls in northcrest. so, if the samples are , the interquartile ranges suggest that the amount of snow typically for northcrest than for grandmont.
Answer
Answer:
The interquartile range for the Grandmont snowfalls in Grandmont is less than the interquartile range for the Northcrest snowfalls in Northcrest. So, if the samples are representative, the interquartile ranges suggest that the amount of snow typically varies more for Northcrest than for Grandmont.
Brief Explanations:
The problem asks to complete a paragraph based on the provided box plots and table showing median and interquartile range (IQR) for snowfalls in Northcrest and Grandmont.
- First blank: Compare the interquartile ranges. From the table, Grandmont's IQR is 4, and Northcrest's IQR is 8. Since 4 < 8, the IQR for Grandmont is less than for Northcrest.
- Second blank: This is a direct comparison from the first blank.
- Third blank: For statistical inferences from samples to a larger population, the samples must be representative.
- Fourth blank: The interquartile range measures the spread or variability of the middle 50% of the data. A larger IQR indicates more variability. Since Northcrest has a larger IQR (8) than Grandmont (4), the amount of snow typically varies more in Northcrest.