the box plots show the average gas mileage of cars and minivans tested by a certain company. which is…
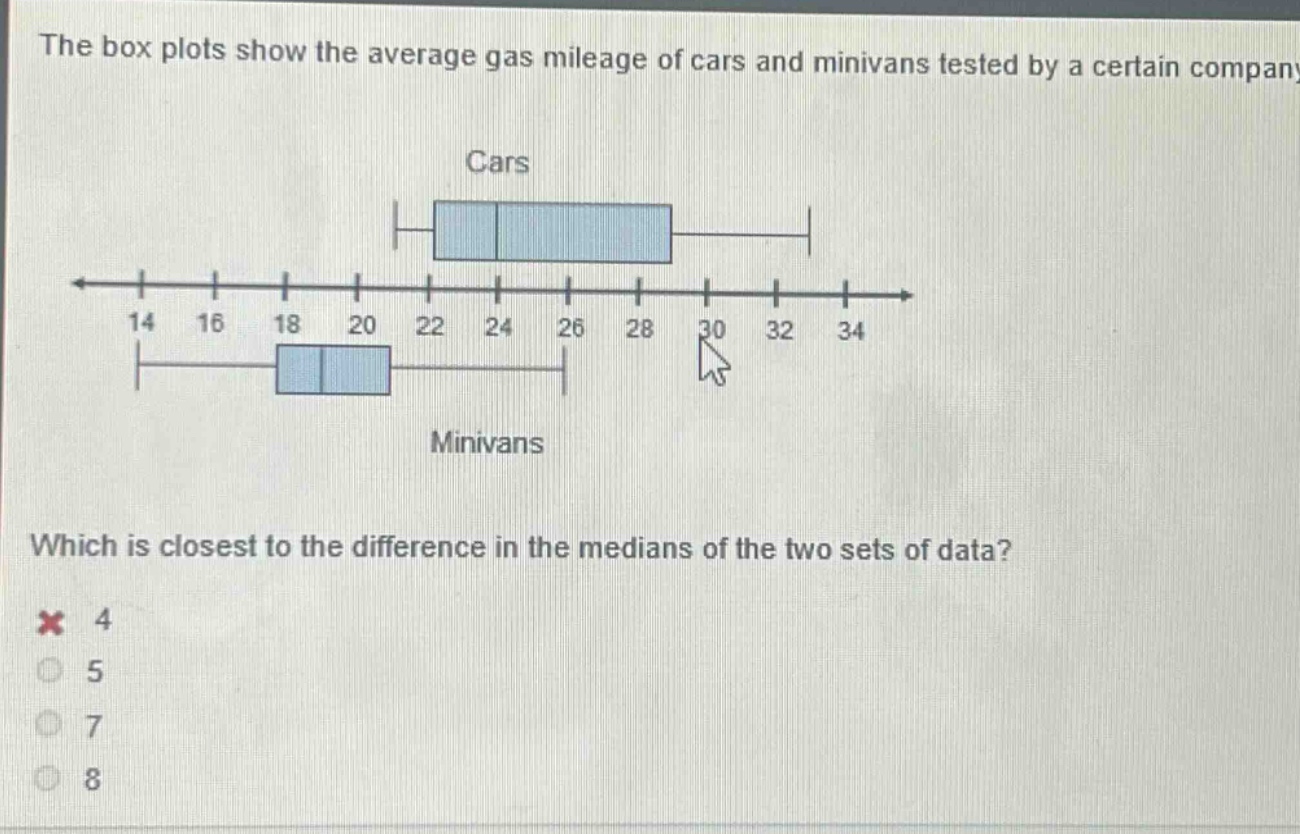
the box plots show the average gas mileage of cars and minivans tested by a certain company. which is closest to the difference in the medians of the two sets of data? 4 5 7 8
Answer
Explanation:
Step1: Identify car - median
The median of the cars' data (the line inside the box) is at 24.
Step2: Identify minivan - median
The median of the minivans' data (the line inside the box) is at 18.
Step3: Calculate difference
Subtract the minivan median from the car median: $24 - 18=6$. But we check the closest option. The closest value to 6 among the options is 5.
Answer:
5