the box plots show the average gas mileage of cars and minivans tested by a certain company. josef says that…
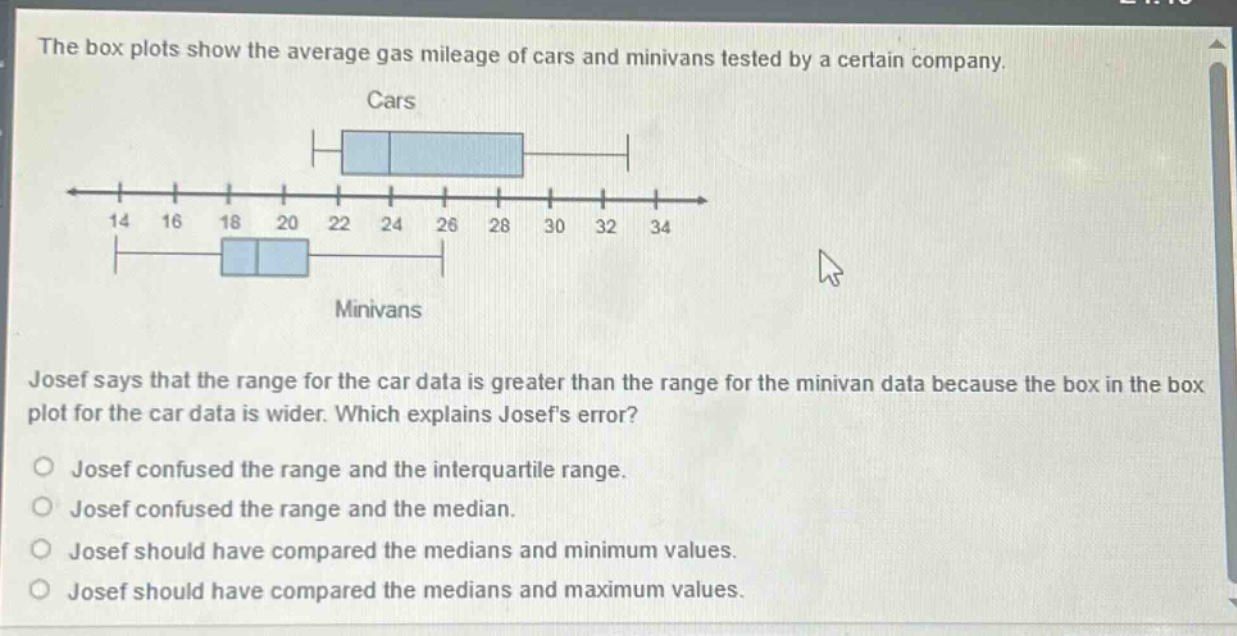
the box plots show the average gas mileage of cars and minivans tested by a certain company. josef says that the range for the car data is greater than the range for the minivan data because the box in the box plot for the car data is wider. which explains josefs error? josef confused the range and the interquartile range. josef confused the range and the median. josef should have compared the medians and minimum values. josef should have compared the medians and maximum values.
Answer
Brief Explanations:
The width of the box in a box - plot represents the interquartile range (IQR), which is the difference between the third quartile ($Q_3$) and the first quartile ($Q_1$). The range is the difference between the maximum and minimum values. Josef confused these two concepts.
Answer:
Josef confused the range and the interquartile range.