the box plots show the average wind speeds, in miles per hour, for two different islands. average wind…
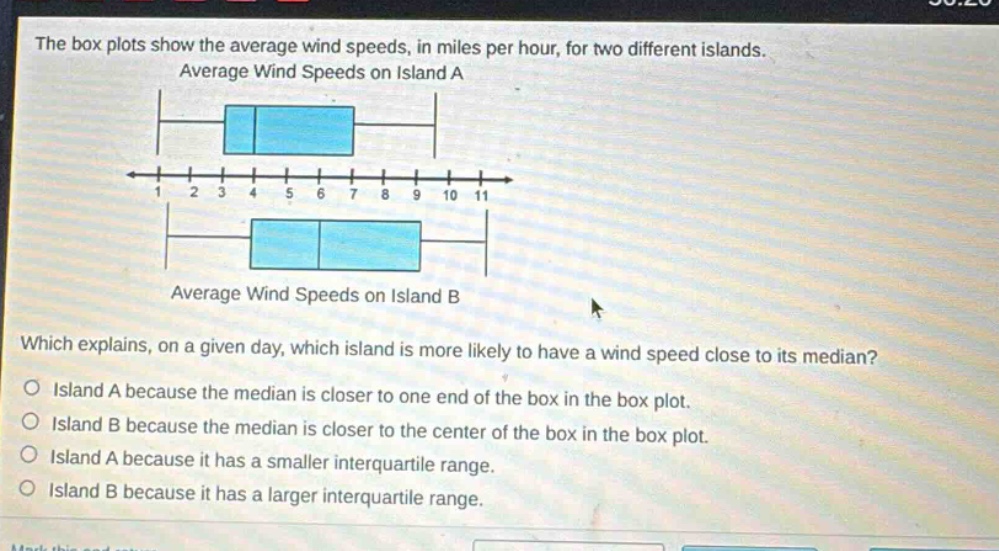
the box plots show the average wind speeds, in miles per hour, for two different islands. average wind speeds on island a average wind speeds on island b which explains, on a given day, which island is more likely to have a wind speed close to its median? island a because the median is closer to one end of the box in the box plot. island b because the median is closer to the center of the box in the box plot. island a because it has a smaller interquartile range. island b because it has a larger interquartile range.
Answer
Explanation:
Step1: Recall box - plot concept
The interquartile range (IQR) in a box - plot represents the middle 50% of the data. A smaller IQR means the data in the middle 50% is more clustered around the median.
Step2: Analyze the options
We want to find the island more likely to have a wind - speed close to its median. A smaller IQR implies that the values are more concentrated around the median.
Answer:
Island A because it has a smaller interquartile range.