the box plots show the data distributions for the number of customers who used a coupon each hour for two…
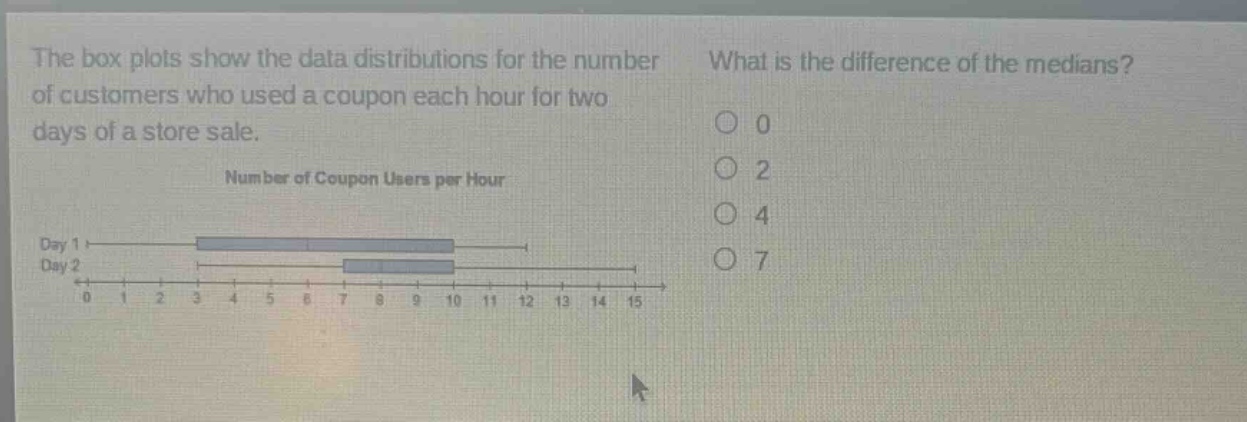
the box plots show the data distributions for the number of customers who used a coupon each hour for two days of a store sale. what is the difference of the medians? number of coupon users per hour day 1 day 2 0 1 2 3 4 5 6 7 8 9 10 11 12 13 14 15 0 2 4 7
Answer
Explanation:
Step1: Identify median of Day 1
The line inside the box - plot for Day 1 is at 7, so the median of Day 1 is 7.
Step2: Identify median of Day 2
The line inside the box - plot for Day 2 is at 3, so the median of Day 2 is 3.
Step3: Calculate difference of medians
Subtract the median of Day 2 from the median of Day 1: $7 - 3=4$.
Answer:
4