the box plots show the data distributions for the number of customers who used a coupon each hour during a…
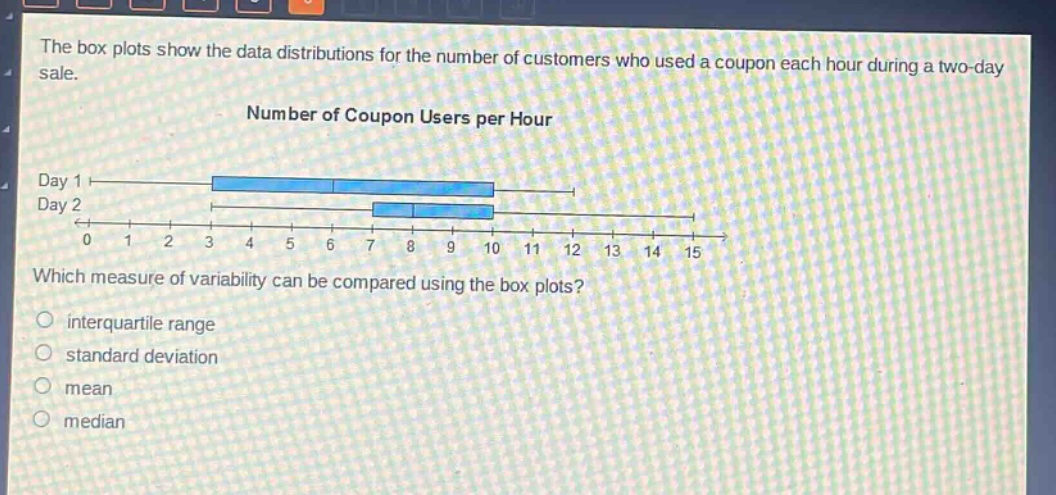
the box plots show the data distributions for the number of customers who used a coupon each hour during a two - day sale.\nnumber of coupon users per hour\nday 1\nday 2\n0 1 2 3 4 5 6 7 8 9 10 11 12 13 14 15\nwhich measure of variability can be compared using the box plots?\ninterquartile range\nstandard deviation\nmean\nmedian
Answer
Brief Explanations:
Box - plots display the five - number summary (minimum, first quartile, median, third quartile, maximum). The interquartile range (IQR) is calculated as $Q_3 - Q_1$, which can be directly obtained from the box - plot. Standard deviation and mean cannot be directly read from a box - plot. Median is a measure of central tendency, not variability.
Answer:
interquartile range