the box plots show the data distributions for the number of laps two students run around a track each day…
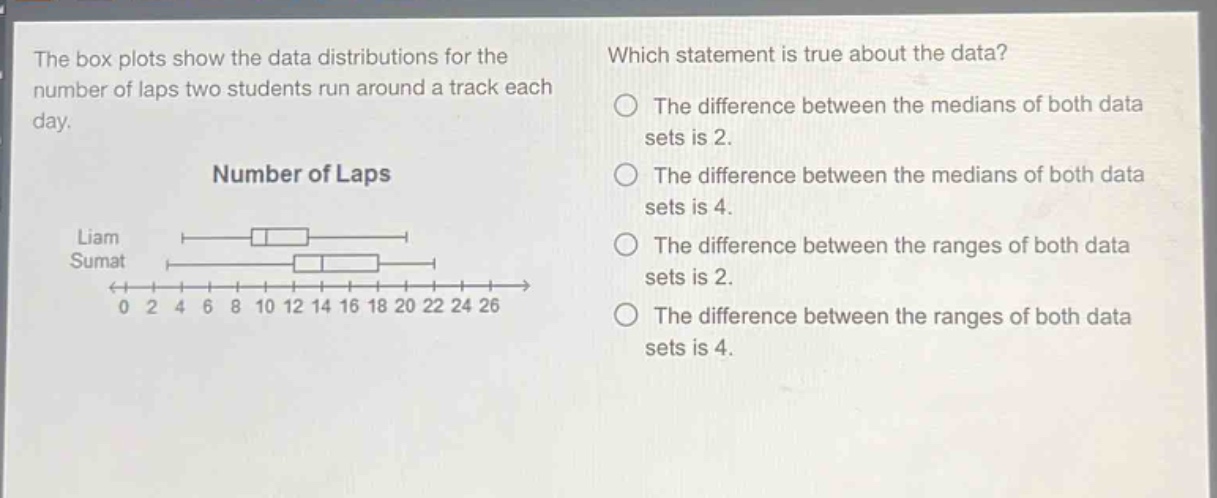
the box plots show the data distributions for the number of laps two students run around a track each day. which statement is true about the data? the difference between the medians of both data sets is 2. the difference between the medians of both data sets is 4. the difference between the ranges of both data sets is 2. the difference between the ranges of both data sets is 4.
Answer
Answer:
The difference between the medians of both data sets is 2.
Explanation:
Step1: Identify Liam's median
From the box - plot, Liam's median is 10.
Step2: Identify Sumat's median
From the box - plot, Sumat's median is 12.
Step3: Calculate median difference
$12 - 10=2$.
Step4: Identify Liam's range
Liam's range is $20 - 4 = 16$.
Step5: Identify Sumat's range
Sumat's range is $24 - 8 = 16$.
Step6: Calculate range difference
$16 - 16 = 0$. So the correct statement is that the difference between the medians of both data sets is 2.