the box - plots below show the distribution of grades in one class on two tests.\n72 73 74 75 76 77 78 79 80…
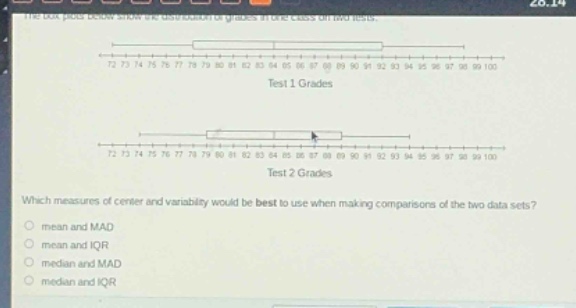
the box - plots below show the distribution of grades in one class on two tests.\n72 73 74 75 76 77 78 79 80 81 82 83 84 85 86 87 88 89 90 91 92 93 94 95 96 97 98 99 100\ntest 1 grades\n72 73 74 75 76 77 78 79 80 81 82 83 84 85 86 87 88 89 90 91 92 93 94 95 96 97 98 99 100\ntest 2 grades\nwhich measures of center and variability would be best to use when making comparisons of the two data sets?\nmean and mad\nmean and iqr\nmedian and mad\nmedian and iqr
Answer
Answer:
median and IQR
Explanation:
Step1: Check data distribution
Box - plots suggest non - normal distribution.
Step2: Recall measure properties
Mean is affected by outliers, median is robust.
Step3: Recall variability measure
MAD is less robust than IQR for non - normal data. IQR is better for skewed data. So median and IQR are best for comparing the two data sets.