the box plots show the distributions of daily temperatures, in °f, for the month of january for two cities…
the box plots show the distributions of daily temperatures, in °f, for the month of january for two cities. which statements are true about the distributions? check all that apply. longview -40 -30 -20 -10 0 10 20 cedar rapids both distributions are symmetric. both distributions are skewed right. both distributions are skewed left. the mean and standard deviation would be the best measures to compare the data. the median and iqr would be the best measures to compare the data.
Answer
Explanation:
Step1: Analyze the skewness of the Longview distribution.
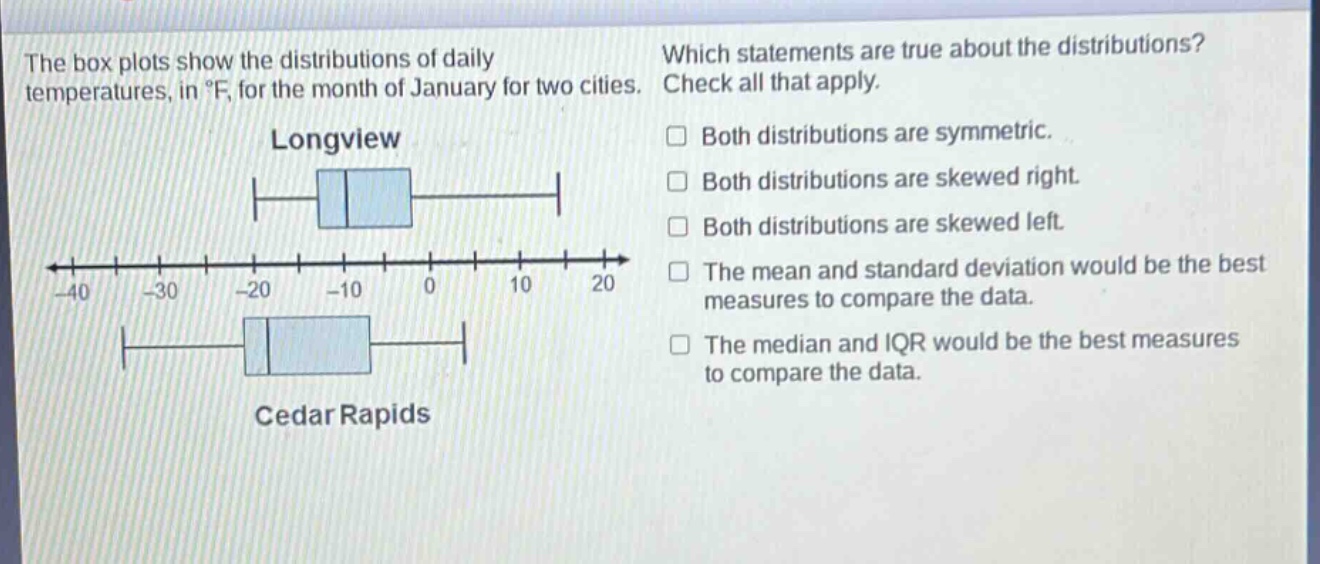
For Longview, the median is approximately $-10$. The distance from the median to Q1 ($-15$) is $5$. The distance from the median to Q3 ($-5$) is $5$. The box is symmetric. However, the right whisker extends from Q3 ($-5$) to the maximum ($15$), a length of $20$. The left whisker extends from Q1 ($-15$) to the minimum ($-20$), a length of $5$. Since the right whisker is much longer than the left whisker, the distribution is skewed right.
Step2: Analyze the skewness of the Cedar Rapids distribution.
For Cedar Rapids, the median is approximately $-15$. The distance from the median to Q1 ($-20$) is $5$. The distance from the median to Q3 ($-5$) is $10$. The right side of the box is longer than the left side. The right whisker extends from Q3 ($-5$) to the maximum ($5$), a length of $10$. The left whisker extends from Q1 ($-20$) to the minimum ($-30$), a length of $10$. Although the whiskers are roughly equal, the median is closer to Q1 than Q3, indicating the distribution is skewed right.
Step3: Evaluate the statements about skewness.
Based on Step 1 and Step 2, both distributions are skewed right. Therefore, the statement "Both distributions are symmetric" is false, "Both distributions are skewed right" is true, and "Both distributions are skewed left" is false.
Step4: Determine the best measures for comparison.
For skewed distributions, the median and Interquartile Range (IQR) are generally considered more robust measures of central tendency and spread, respectively, compared to the mean and standard deviation. The mean is pulled in the direction of the skew, and the standard deviation is sensitive to extreme values. Since both distributions are skewed right, the median and IQR are the better measures for comparison.
Step5: Select the true statements.
Based on the analysis:
- "Both distributions are skewed right" is true.
- "The median and IQR would be the best measures to compare the data" is true.
Answer:
Both distributions are skewed right. The median and IQR would be the best measures to compare the data.