the box plots show the distributions of the numbers of words per line in an essay printed in two different…
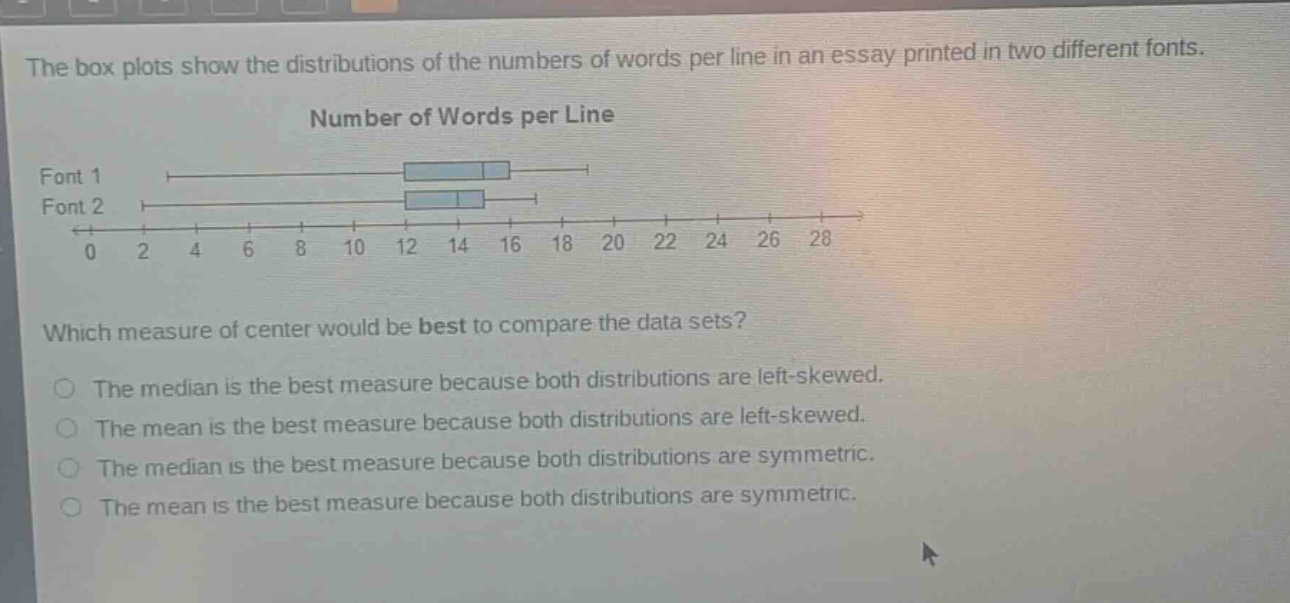
the box plots show the distributions of the numbers of words per line in an essay printed in two different fonts. number of words per line font 1 font 2 0 2 4 6 8 10 12 14 16 18 20 22 24 26 28 which measure of center would be best to compare the data sets? the median is the best measure because both distributions are left - skewed. the mean is the best measure because both distributions are left - skewed. the median is the best measure because both distributions are symmetric. the mean is the best measure because both distributions are symmetric.
Answer
Answer:
The median is the best measure because both distributions are left - skewed.
Explanation:
Step1: Understand measure of center
Mean and median are measures of center.
Step2: Analyze skewed data
For skewed data, median is better.
Step3: Check skewness
Box - plots show left - skewed distributions. So median is best.