the box plots show the distributions of weights of cucumbers and zucchini collected from a garden. weights…
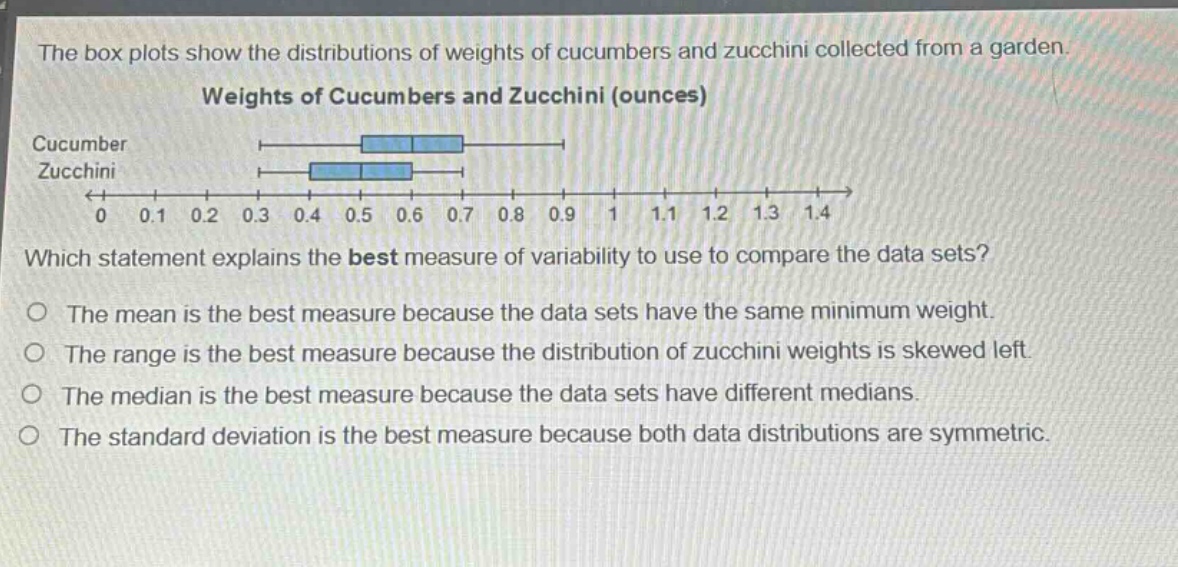
the box plots show the distributions of weights of cucumbers and zucchini collected from a garden. weights of cucumbers and zucchini (ounces) cucumber zucchini 0 0.1 0.2 0.3 0.4 0.5 0.6 0.7 0.8 0.9 1 1.1 1.2 1.3 1.4 which statement explains the best measure of variability to use to compare the data sets? the mean is the best measure because the data sets have the same minimum weight. the range is the best measure because the distribution of zucchini weights is skewed left. the median is the best measure because the data sets have different medians. the standard deviation is the best measure because both data distributions are symmetric.
Answer
Brief Explanations:
When data distributions are symmetric, the standard - deviation is a good measure of variability. Mean and median are measures of central tendency, not variability. Range is not the best when distributions are symmetric as it only considers the minimum and maximum values. Since both data distributions (from the box - plots) appear to be symmetric, standard deviation is the best measure of variability.
Answer:
The standard deviation is the best measure because both data distributions are symmetric.