the box plots show the heights of sunflower plants in a random sample of 40 plants from field a and a random…
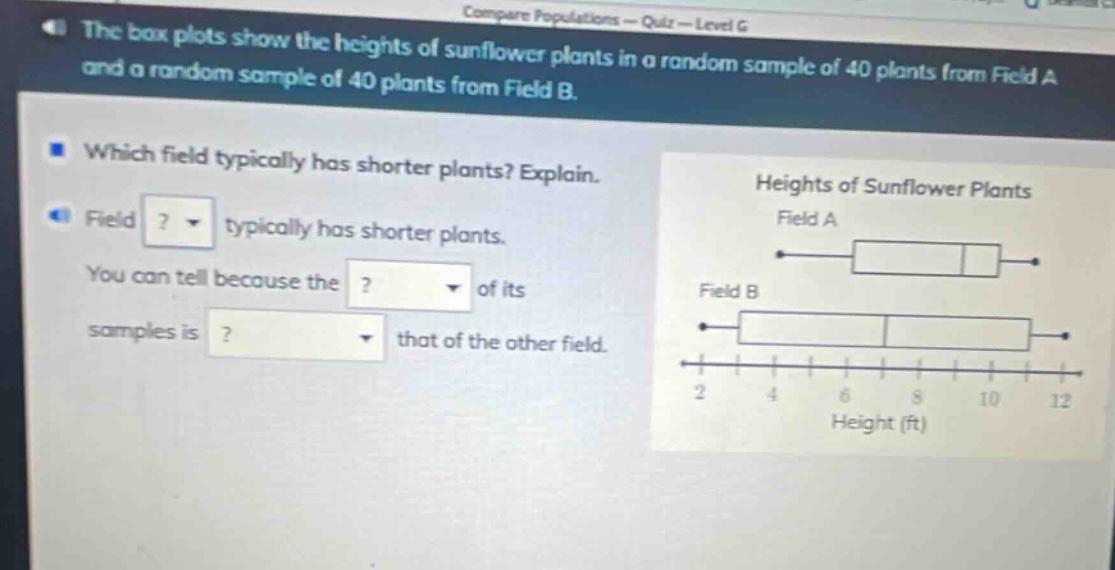
the box plots show the heights of sunflower plants in a random sample of 40 plants from field a and a random sample of 40 plants from field b. which field typically has shorter plants? explain. field ? typically has shorter plants. you can tell because the ? of its samples is ? that of the other field. heights of sunflower plants field a field b 2 4 6 8 10 12 height (ft)
Answer
Explanation:
Step1: Identify median in box - plots
The median is the middle - value in a data set represented by the line inside the box of a box - plot.
Step2: Compare medians
The median of Field A is around 8 ft and the median of Field B is around 6 ft. Since 6 < 8, Field B has a lower median.
Answer:
Field B; median; less than