the box plots show the heights of sunflower plants in a random sample of 40 plants from field a and a random…
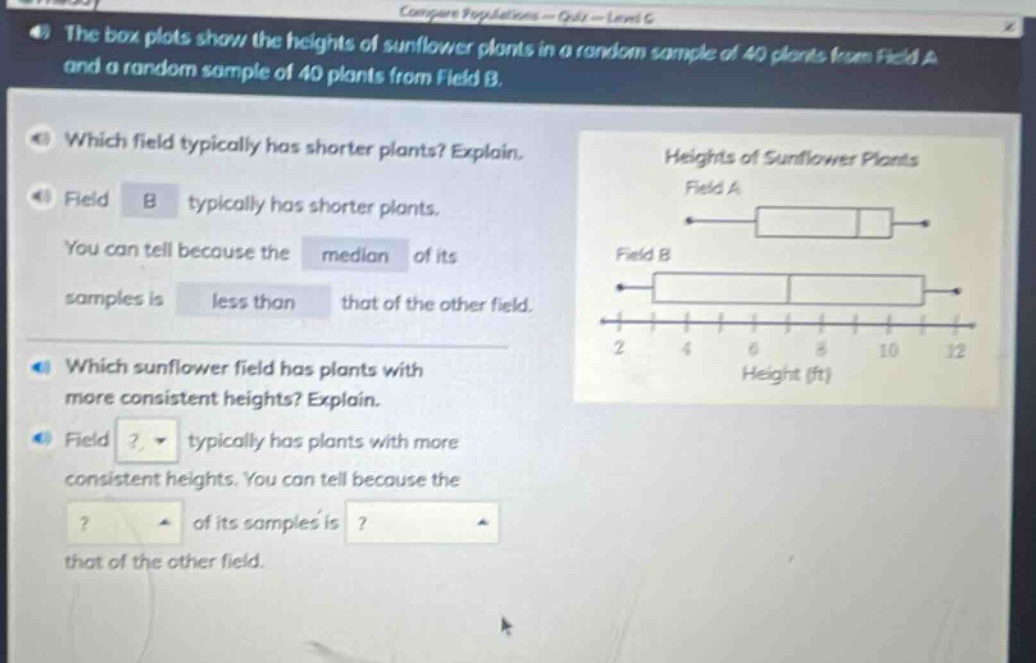
the box plots show the heights of sunflower plants in a random sample of 40 plants from field a and a random sample of 40 plants from field b. which field typically has shorter plants? explain. field b typically has shorter plants. you can tell because the median of its samples is less than that of the other field. which sunflower field has plants with more consistent heights? explain. field? typically has plants with more consistent heights. you can tell because the? of its samples is? that of the other field.
Answer
Explanation:
Step1: Recall measure of consistency
The inter - quartile range (IQR) is a measure of data consistency. A smaller IQR means more consistent data.
Step2: Analyze box - plots
For box - plots, the length of the box represents the IQR. The box for Field A is shorter than the box for Field B.
Answer:
Field A typically has plants with more consistent heights. You can tell because the inter - quartile range of its samples is less than that of the other field.