the box plots show a random sample of wait times for two rides at a water park. compare the wait times in…
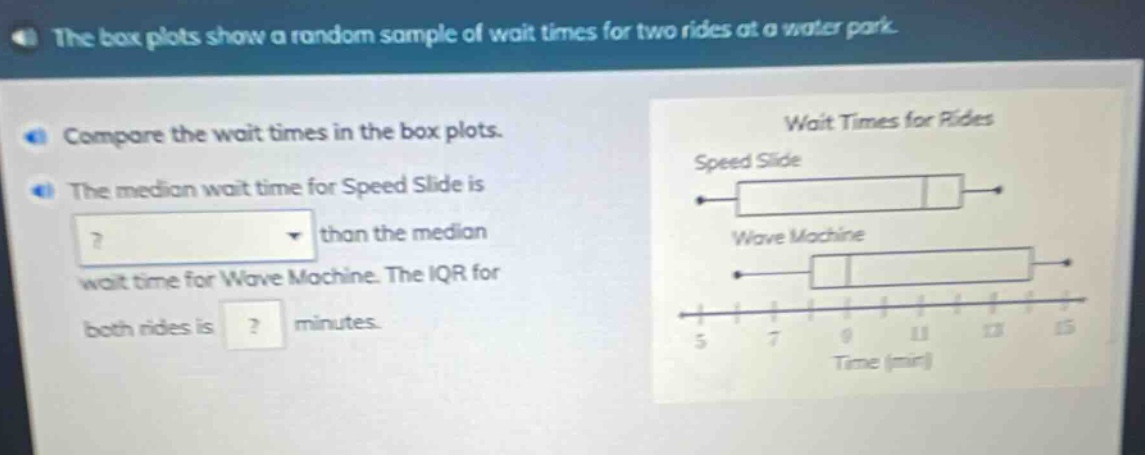
the box plots show a random sample of wait times for two rides at a water park. compare the wait times in the box plots. the median wait time for speed slide is? than the median wait time for wave machine. the iqr for both rides is? minutes. wait times for rides speed slide wave machine 5 7 9 11 13 15 time (min)
Answer
Explanation:
Step1: Identify median values
The median of Speed - Slide is at 10 minutes and the median of Wave - Machine is at 9 minutes. Since 10>9, the median wait - time for Speed Slide is greater than the median wait - time for Wave Machine.
Step2: Calculate IQR
The IQR (Inter - Quartile Range) is the difference between the third quartile ($Q_3$) and the first quartile ($Q_1$). For Speed Slide, $Q_1 = 8$ and $Q_3 = 12$, so $IQR_{SpeedSlide}=12 - 8=4$. For Wave Machine, $Q_1 = 7$ and $Q_3 = 11$, so $IQR_{WaveMachine}=11 - 7 = 4$.
Answer:
greater; 4