which box - and - whisker plot represents this data: 6, 7, 8, 10, 18, 20, 22, 25, 28, 28, 30, 30?
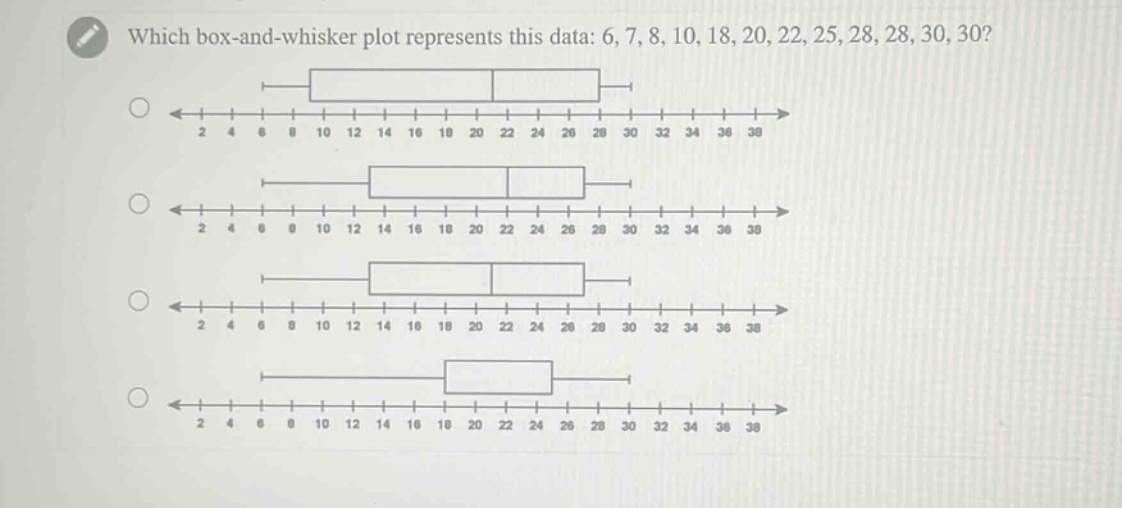
which box - and - whisker plot represents this data: 6, 7, 8, 10, 18, 20, 22, 25, 28, 28, 30, 30?
Answer
Explanation:
Step1: Find the minimum value
The minimum value of the data - set (6,7,8,10,18,20,22,25,28,28,30,30) is (6).
Step2: Find the first - quartile ((Q_1))
The data - set has (n = 12) values. The lower half of the data is (6,7,8,10,18,20). The median of the lower half ((Q_1)) is (\frac{8 + 10}{2}=9).
Step3: Find the median ((Q_2))
Since (n = 12), the median (Q_2=\frac{20 + 22}{2}=21).
Step4: Find the third - quartile ((Q_3))
The upper half of the data is (22,25,28,28,30,30). The median of the upper half ((Q_3)) is (\frac{28+28}{2}=28).
Step5: Find the maximum value
The maximum value of the data - set is (30).
The box - and - whisker plot should have the left - most point (minimum) at (6), the left edge of the box ((Q_1)) at (9), the line inside the box ((Q_2)) at (21), the right edge of the box ((Q_3)) at (28), and the right - most point (maximum) at (30).
Answer:
We need to visually inspect the given box - and - whisker plots to find the one that matches the values of (6) (minimum), (9) ((Q_1)), (21) (median), (28) ((Q_3)), and (30) (maximum). Without the ability to directly select from the visual options provided in the image, the steps above outline how to determine the correct box - and - whisker plot. If you were to check the plots, look for the one with the whisker starting at (6), the left side of the box at (9), the middle line of the box at (21), the right side of the box at (28), and the right - hand whisker ending at (30).