which box - and - whisker plot represents this data: 6, 9, 13, 13, 18, 20, 24, 25, 26, 28, 30, 30?
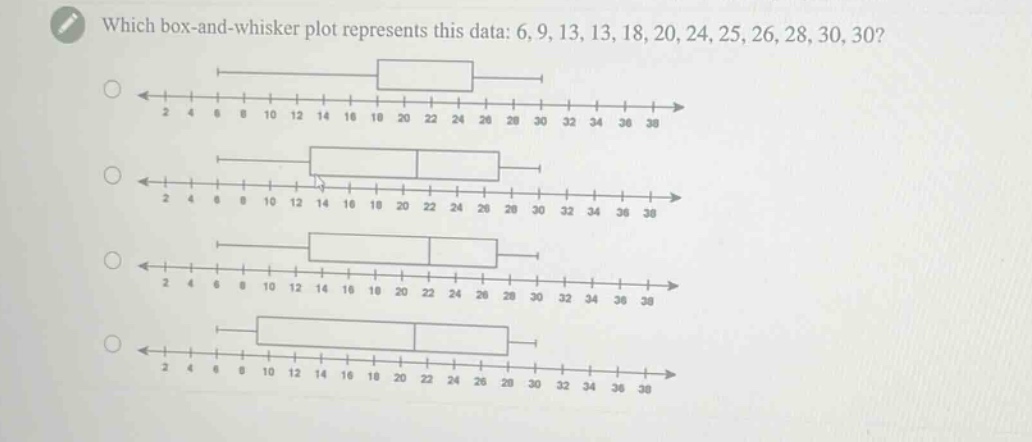
which box - and - whisker plot represents this data: 6, 9, 13, 13, 18, 20, 24, 25, 26, 28, 30, 30?
Answer
Answer:
To determine the correct box - and - whisker plot, we need to find the five - number summary (minimum, first quartile $Q_1$, median, third quartile $Q_3$, maximum) of the data set ${6,9,13,13,18,20,24,25,26,28,30,30}$.
- Minimum value:
- The minimum value of the data set is $6$.
- Median ($Q_2$):
- Since there are $n = 12$ data points, the median is the average of the $\frac{n}{2}=6$th and $(\frac{n}{2}+1) = 7$th ordered data points.
- The $6$th value is $20$ and the $7$th value is $24$. So, the median $Q_2=\frac{20 + 24}{2}=22$.
- First quartile ($Q_1$):
- The lower half of the data set is ${6,9,13,13,18,20}$. Since there are $n_1=6$ data points in the lower half, the first quartile is the average of the $\frac{n_1}{2}=3$rd and $(\frac{n_1}{2}+1)=4$th ordered data points in the lower - half.
- The $3$rd value is $13$ and the $4$th value is $13$. So, $Q_1 = 13$.
- Third quartile ($Q_3$):
- The upper half of the data set is ${24,25,26,28,30,30}$. Since there are $n_2 = 6$ data points in the upper half, the third quartile is the average of the $\frac{n_2}{2}=3$rd and $(\frac{n_2}{2}+1)=4$th ordered data points in the upper - half.
- The $3$rd value is $26$ and the $4$th value is $28$. So, $Q_3=\frac{26+28}{2}=27$.
- Maximum value:
- The maximum value of the data set is $30$.
The box - and - whisker plot has the following characteristics:
- The left - most point (whisker) is at the minimum value ($6$).
- The left - hand side of the box is at $Q_1 = 13$.
- The line inside the box is at the median $Q_2=22$.
- The right - hand side of the box is at $Q_3 = 27$.
- The right - most point (whisker) is at the maximum value ($30$).
We would need to visually inspect the given box - and - whisker plots to find the one that matches these values. But the steps to construct the five - number summary are as above.
Since no options are labeled, we can't directly pick an option. But if we were to construct the box - and - whisker plot, it would have a whisker starting at $6$, the left - side of the box at $13$, the middle line of the box at $22$, the right - side of the box at $27$, and a whisker ending at $30$.