which box - and - whisker plot represents the data set? 10, 5, 8, 14, 21, 7, 13, 17, 17
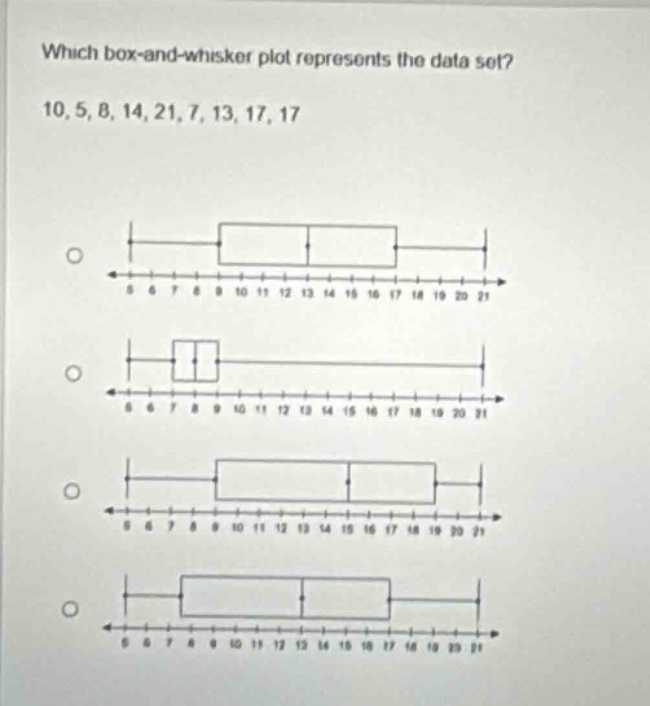
which box - and - whisker plot represents the data set? 10, 5, 8, 14, 21, 7, 13, 17, 17
Answer
Explanation:
Step1: Sort the data set
$5,7,8,10,13,14,17,17,21$
Step2: Find the median (Q2)
Since there are 9 data - points, the median is the 5th value. So, $Q2 = 13$.
Step3: Find the lower half data set
The lower half is $5,7,8,10$. The median of the lower half (Q1) is $\frac{7 + 8}{2}=7.5$.
Step4: Find the upper half data set
The upper half is $14,17,17,21$. The median of the upper half (Q3) is $\frac{17+17}{2}=17$.
Step5: Identify the minimum and maximum
The minimum value is 5 and the maximum value is 21.
The box - and - whisker plot should have the minimum at 5, Q1 at 7.5, Q2 at 13, Q3 at 17, and the maximum at 21.
Answer:
The box - and - whisker plot with the minimum at 5, the left - hand side of the box at 7.5, the line inside the box at 13, the right - hand side of the box at 17, and the maximum at 21. (Without seeing the exact visual options clearly, you would match these values to the correct plot from the given choices).